Call Center BPO KPIs That Actually Predict Revenue (Not Just “Answer Rate”)
By Eddie FieldsLast modified: March 10, 2026
Voted Top Call Center for 2024 by Forbes
Virtual Receptionists
Save time and money with our virtual receptionists.
AI Receptionist
AI-powered receptionist that answers, routes, and qualifies calls 24/7.
Enterprise Solutions
Solutions designed to scale with your organization’s needs.
Legal Services
Our virtual legal receptionists are experts in legal intake.
Last modified: March 10, 2026
Most call center BPO reporting is built around “activity” metrics: answer rate, average speed of answer (ASA), handle time, and service level. Those numbers matter for coverage, but they do not reliably tell you whether your outsourced contact center is producing booked appointments, retained cases, or revenue.
This article is for enterprise and multi-location service businesses, intake-heavy legal teams, and healthcare practices that depend on high-volume inbound calls, overflow, and after-hours coverage. You will learn which call center KPI and contact center analytics measures predict revenue, how to define them so they are audit-proof, and how to operationalize them in a QA scorecard and BPO reporting pack.
Answer rate is a coverage metric, not an outcome metric. A “answered” call can still produce zero value if the caller hangs up after 5 seconds, reaches the wrong location, gets a weak intake, or never receives a promised callback.
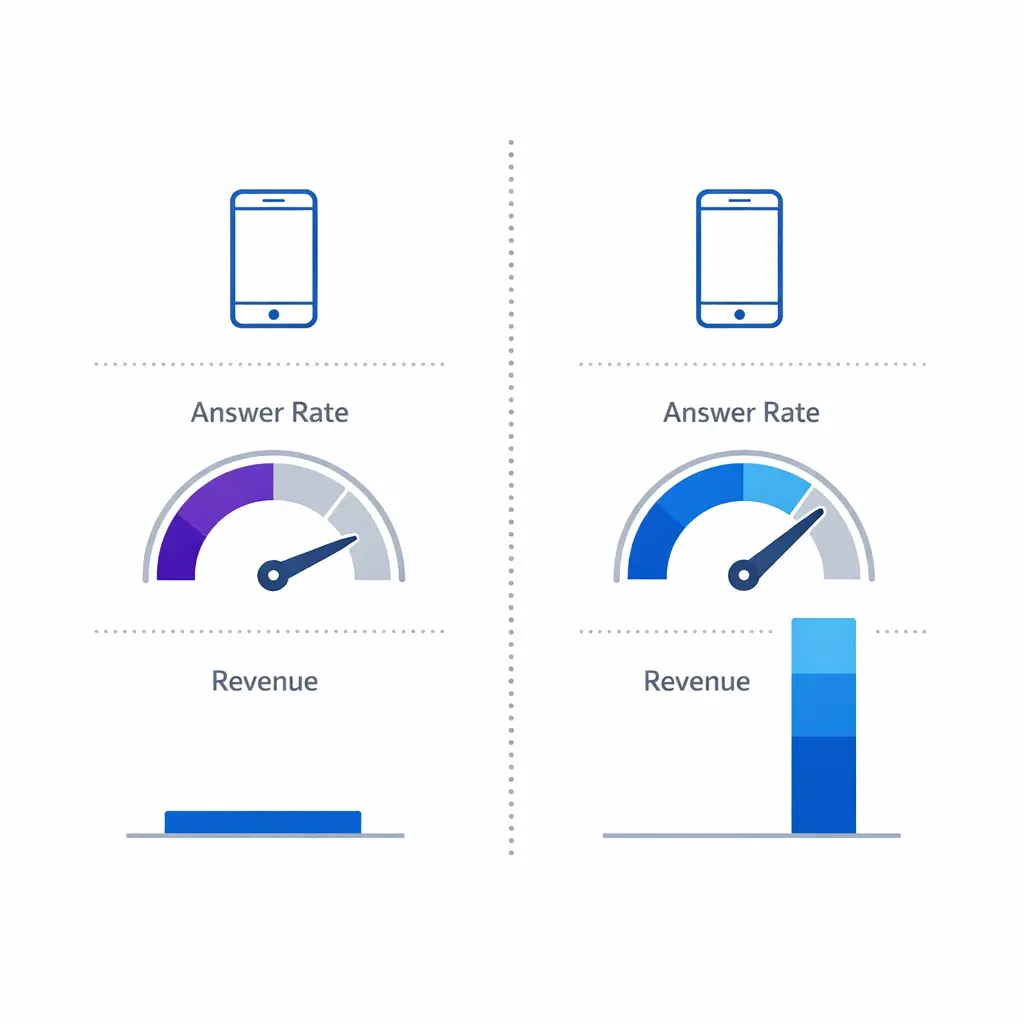
Answer rate also hides the two issues that typically drive revenue leakage: whether you reached the right caller at the right moment, and whether the conversation produced the next committed step (appointment, retained case, deposit, dispatch, or resolved issue).
step (appointment, retained case, deposit, dispatch, or resolved issue).
Revenue from inbound demand usually follows a simple funnel: capture the contact, connect live, qualify correctly, convert to a next step, and keep the customer from falling out later. Your contact center KPIs should mirror that funnel.
As a result, the most useful call center KPI metrics are “leading indicators” for downstream revenue outcomes, not just operational throughput. That means tying front-line interactions to a measurable business event in your CRM, practice management system, or intake system.
Use a KPI stack that separates coverage from conversion and quality. This prevents teams from “winning” on a dashboard while revenue quietly declines.
Coverage: Did you make contact possible? (availability, missed call recovery)
Conversion: Did a real conversation produce the next step? (speed to lead, connect rate, call conversion rate)
Quality: Was the outcome achieved correctly and compliantly? (first call resolution, QA scorecard performance)
Data integrity: Can you attribute results to channels, agents, and vendors? (disposition accuracy, CRM sync completeness)
Unit economics: Are you buying revenue efficiently? (cost per qualified intake, revenue per staffed hour)
Definition: The elapsed time from a lead event (form fill, chat-to-call handoff, voicemail, missed call) to the first outbound attempt, and separately to first live contact.
Speed matters because lead intent decays quickly; research on lead response management shows that faster follow-up improves the chance of reaching and qualifying a lead, which then increases conversion probability over the rest of the funnel. If you need a research-backed foundation for this KPI, start with the lead response management research published on SSRN.
How to use it: Track percentile performance, not only averages. Averages hide a long tail of leads that wait hours or days and quietly destroy ROI.
Definition: The percentage of inbound demand that results in a live conversation with an appropriate agent. In many environments, “demand” should include missed calls and voicemails, not just answered calls.
Formula: Connect Rate = Live Conversations / (Inbound Calls + Missed Calls + Voicemails + Scheduled Callbacks Due)
Why it predicts revenue: You cannot convert what you do not connect. Connect rate is usually the earliest KPI that exposes understaffing, routing errors, language gaps, and after-hours coverage problems.
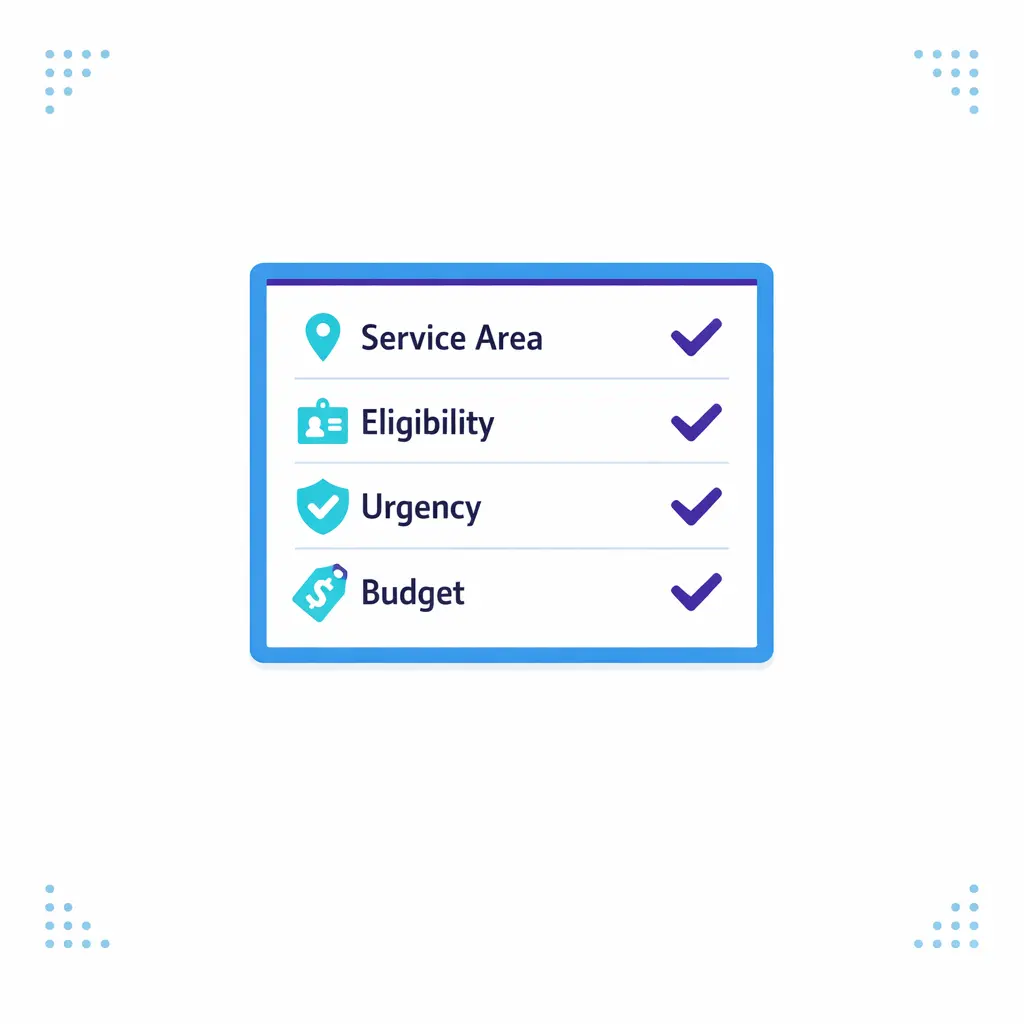
Definition: The percentage of live conversations that meet your definition of a qualified opportunity. “Qualified” must be explicit (service area, practice type, payer type, case criteria, urgency, budget, eligibility, and so on).
Formula: Qualified Intake Rate = Qualified Intakes / Live Conversations
Implementation note: This is where BPO reporting often breaks. If “qualified” is based on agent self-reporting without auditing, the KPI becomes an optimism metric instead of a revenue predictor.
Definition: The percentage of qualified intakes that convert to a defined next step within a defined time window. The “next step” should match your business model: booked appointment, dispatch created, signed retainer, deposit collected, consultation scheduled, or transfer accepted by sales.
Formula: Call Conversion Rate = Conversions / Qualified Intakes
What to segment: Separate new customers from existing customers, business hours from after-hours, and marketing-sourced calls from existing demand. A blended call conversion rate often hides channel waste and staffing mismatches.
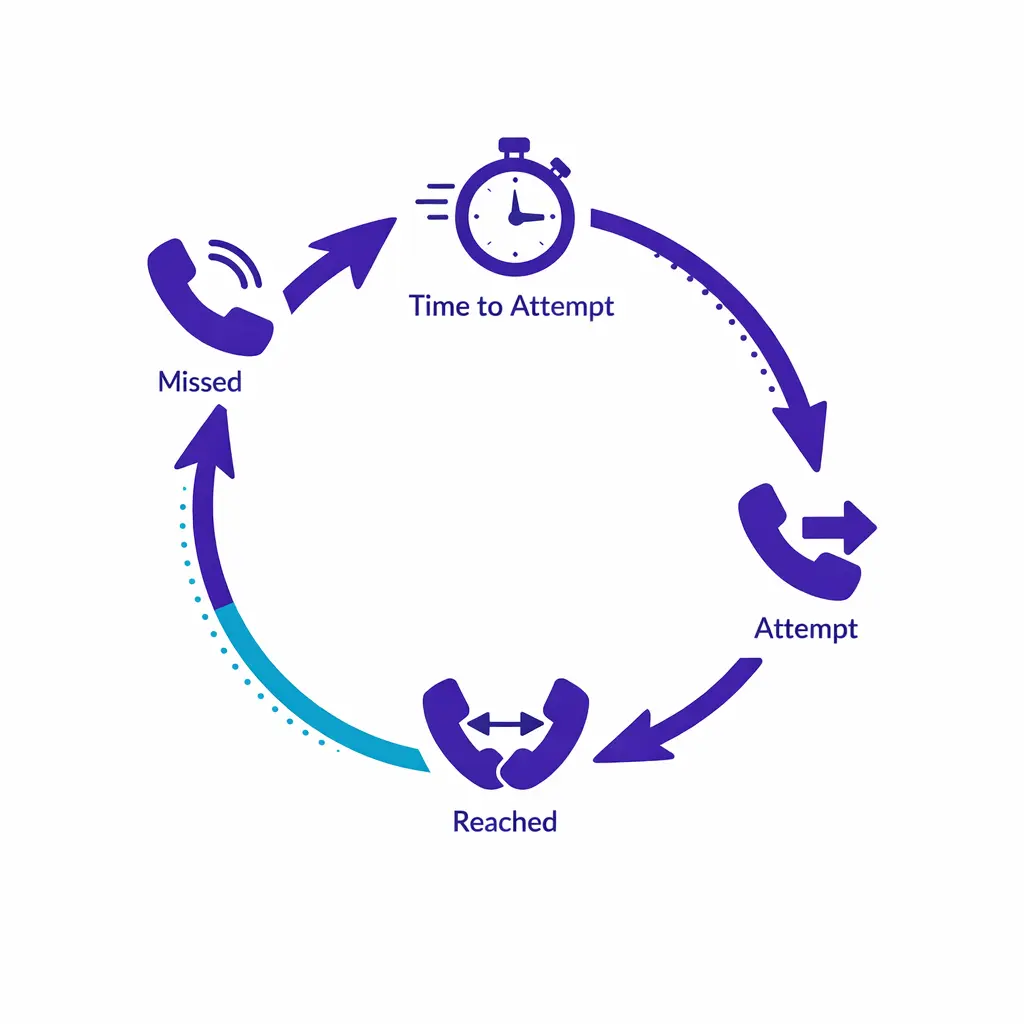
Definition: The percentage of missed calls that receive a documented recovery attempt and ultimately result in a live conversation or conversion. This KPI is often the fastest path to incremental revenue because the demand already exists.
Formulas: Missed Call Recovery Attempt Rate = Missed Calls With Attempt / Total Missed Calls. Missed Call Recovery Conversion Rate = Recovered Conversions / Total Missed Calls.
Operational rule: If you only track “callbacks made,” you can still lose revenue. Pair attempt rate with time-to-first-attempt and with a real outcome: reached, qualified, booked, retained.
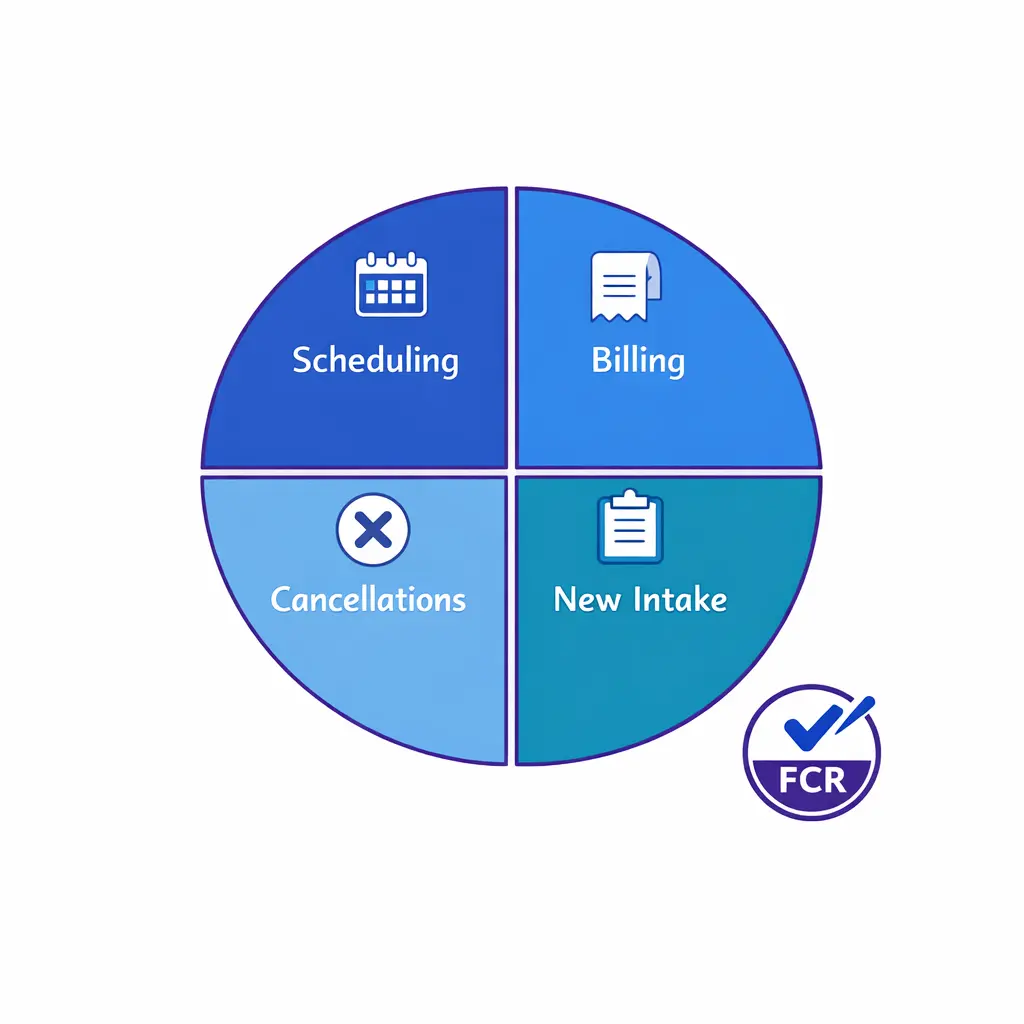
Definition: The percentage of interactions resolved on the first contact without repeat calls, escalations, or rework. Many teams define FCR differently, so you must document your definition and measurement window before comparing across locations or vendors.
FCR is consistently tied to customer satisfaction and lower cost to serve in contact center benchmarking, which is why it often predicts renewals, repeat business, and fewer revenue-eroding service failures. If you need an external benchmark-oriented perspective, see SQM Group’s first call resolution research and benchmarking overview (industry benchmarking).
Implementation note: For revenue prediction, measure “FCR for revenue-critical intents” separately (new patient scheduling, new case intake, high-value service requests, cancellations, billing issues). A single blended FCR number is rarely actionable.
Definition: A weighted quality assurance scorecard that measures both compliance and conversion behaviors. A mature QA scorecard does not reward “nice calls” that fail to capture the information needed to close the loop.
If you want a standards anchor for contact center service provision and quality practices, reference ISO 18295-1 for customer contact centres when designing scorecard controls, calibration, and documented processes.
What to include (example categories):
Intake accuracy: correct service line, location, urgency, eligibility
Data capture: required fields completed, spelling, phone/email validation
Conversion behaviors: clear recommendation, next-step commitment, scheduling discipline
Compliance: disclosures, consent language, protected information handling
Customer experience: professionalism, empathy, de-escalation
What makes it revenue-predictive: Track QA scorecard results by downstream outcome (booked vs not booked, retained vs not retained). When QA correlates with outcomes, coaching becomes a revenue lever instead of a policing exercise.
Definition: The percentage of interactions whose final disposition matches an audit-truth standard (QA review, CRM record, or downstream event). This is the KPI that determines whether your contact center analytics dashboard is reliable.
Why it predicts revenue: If dispositions are wrong, every conversion KPI becomes noisy, and marketing and operations decisions become guesswork. Improving disposition accuracy often improves revenue without changing staffing, because it enables targeted fixes (script, routing, eligibility rules, training).
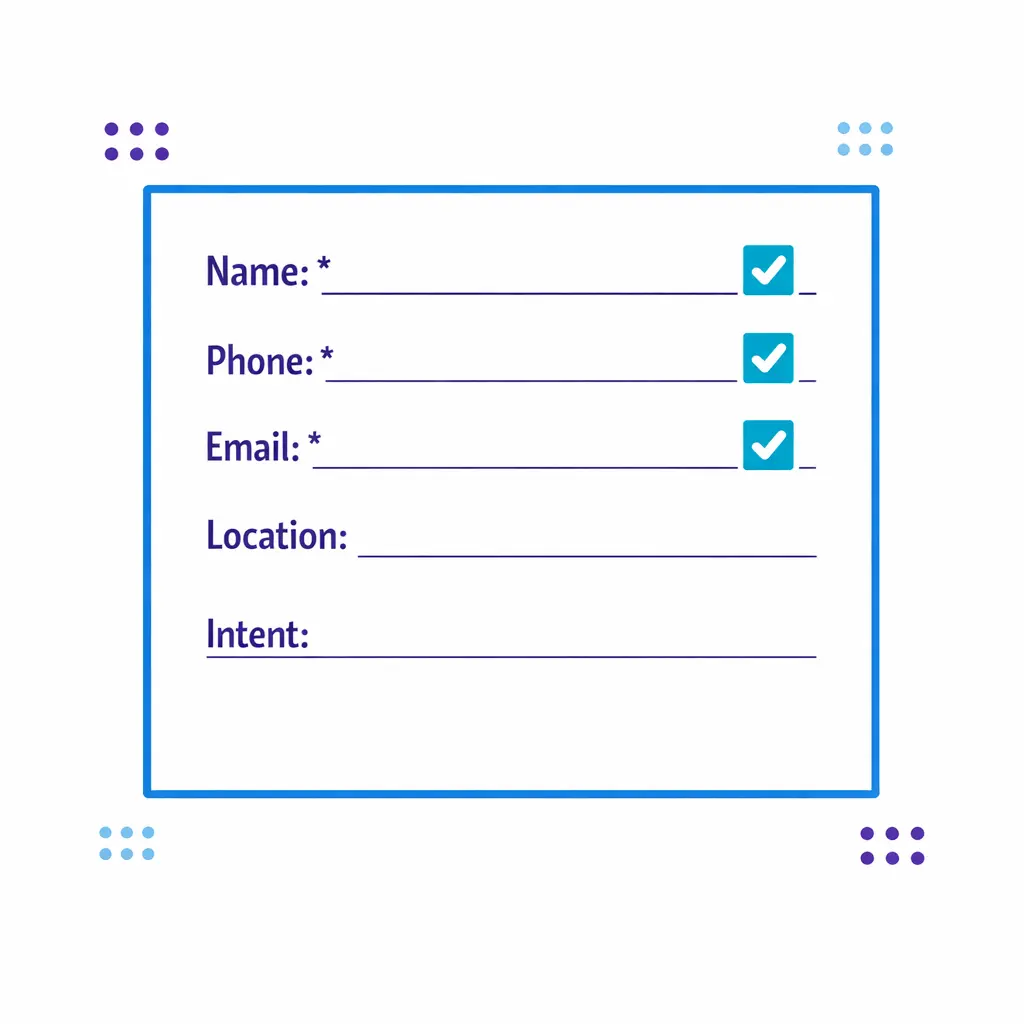
Definition: The percentage of qualified intakes with the required fields completed for follow-up and conversion. In legal and healthcare, missing fields can prevent scheduling, eligibility checks, or case review and create silent leakage.
Formula: Data Completeness Rate = Records With Required Fields / Qualified Intakes
How to make it practical: Keep the “required fields” list short and role-specific, then audit it weekly. Do not penalize agents for fields that your systems make hard to capture (for example, multi-screen workflows or unclear prompts).
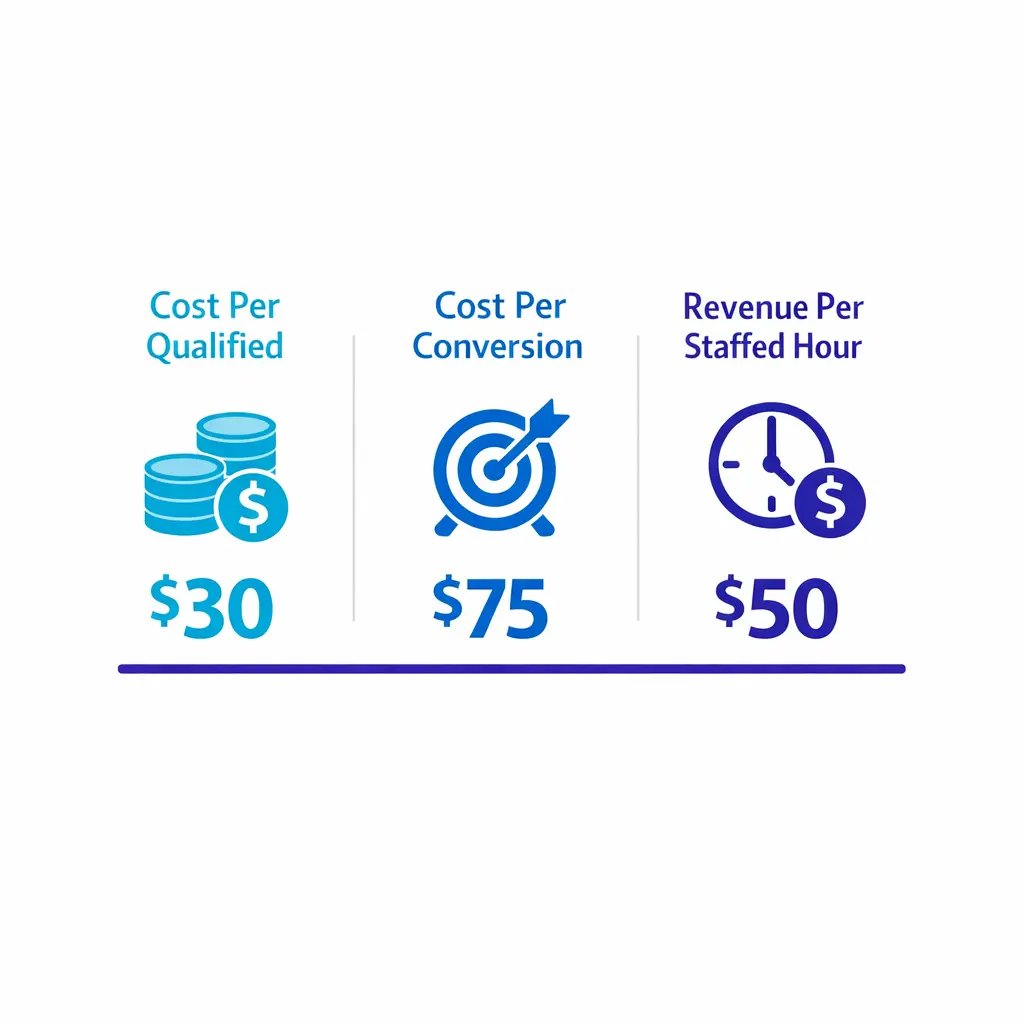
Definition: The economic KPIs that let finance and operations evaluate whether the BPO is producing profitable growth, not just activity. These should be calculated per channel, per location group, and per intent type when possible.
Examples: Cost per Qualified Intake = Total BPO Cost / Qualified Intakes. Cost per Booked Appointment = Total BPO Cost / Booked Appointments. Revenue per Staffed Hour = Attributed Revenue / Staffed Hours.
Implementation note: If you cannot attribute revenue directly, use proxy outcomes that correlate strongly with revenue in your business (kept appointment, retained case, paid invoice). The key is consistency and auditability.
Enterprise buyers increasingly expect BPO reporting that ties front-end interactions to downstream outcomes, with defensible definitions and audit trails. This is pushing teams toward tighter CRM integrations, standardized disposition taxonomies, and QA programs that measure outcome quality, not just politeness.
At the same time, more organizations are applying speech analytics call center tooling to scale coaching and detect process failures, which raises governance questions about how models are selected, monitored, and used. If you are evaluating AI-driven contact center analytics, the NIST AI Risk Management Framework (AI RMF) is a useful reference for documenting risk controls and accountability.
If you handle protected health information (PHI) in a healthcare practice, outsourced call handling typically requires vendor controls beyond “good customer service.” Under the HIPAA Privacy Rule guidance from HHS, you should design workflows to minimize unnecessary disclosure and to support permitted uses of PHI.
When a vendor creates, receives, maintains, or transmits PHI on behalf of a covered entity, it is generally treated as a business associate, which is why contract structure and operational controls matter as much as speed and conversion. HHS provides a plain-language overview of HIPAA business associates and business associate agreements (BAAs) that can help shape your vendor requirements.
Routing accuracy often predicts revenue more than raw speed. If a caller reaches the wrong branch, the “answer” still counts, but the conversion probability drops.
Location-match rate: correct branch or territory on the first connection
Booked-to-kept rate: booked appointments that actually occur (a key downstream quality signal)
After-hours capture rate: qualified intakes captured outside business hours
Legal intake is usually a two-stage funnel: qualify the case and then convert to a signed next step (retainer, engagement, or attorney consult). The revenue KPI is not “calls answered,” it is qualified cases that make it through conflict checks, case review, and signature.
Case qualification accuracy: audit whether the intake meets firm criteria
Signed-step rate: qualified intakes that reach signed engagement within a window
Critical-field completeness: facts needed for attorney review captured correctly
Healthcare conversion is often constrained by eligibility, urgency, provider availability, and patient friction. Here, “quality” includes correct scheduling, correct patient expectations, and tight follow-up on missed calls and voicemails.
Appointment conversion rate: qualified calls that become booked appointments
Schedule accuracy: correct provider, visit type, and time slot
Follow-up cycle time: time from missed call/voicemail to successful contact
Fast answers can coexist with poor outcomes if agents are undertrained, routing is wrong, or scripts fail to secure commitment. Use answer rate as a guardrail, then manage to conversion and quality KPIs.
Average speed to lead and average handle time can look healthy while a meaningful percentage of contacts are handled extremely late or extremely poorly. Track percentiles (50th, 75th, 90th) so “tail risk” is visible.
Existing customers often resolve faster and at higher satisfaction, which can inflate FCR and QA results. Segment KPIs by intent and customer type to avoid over-crediting performance.
A QA scorecard that rewards tone but ignores intake accuracy will not predict revenue. Tie QA to downstream validation: booked appointments that stick, cases that are accepted, follow-ups that reach the customer.
If your taxonomy is messy, your reporting will drift. Disposition accuracy and completeness should be treated as first-class KPIs, because they determine whether your contact center data analytics can be trusted.
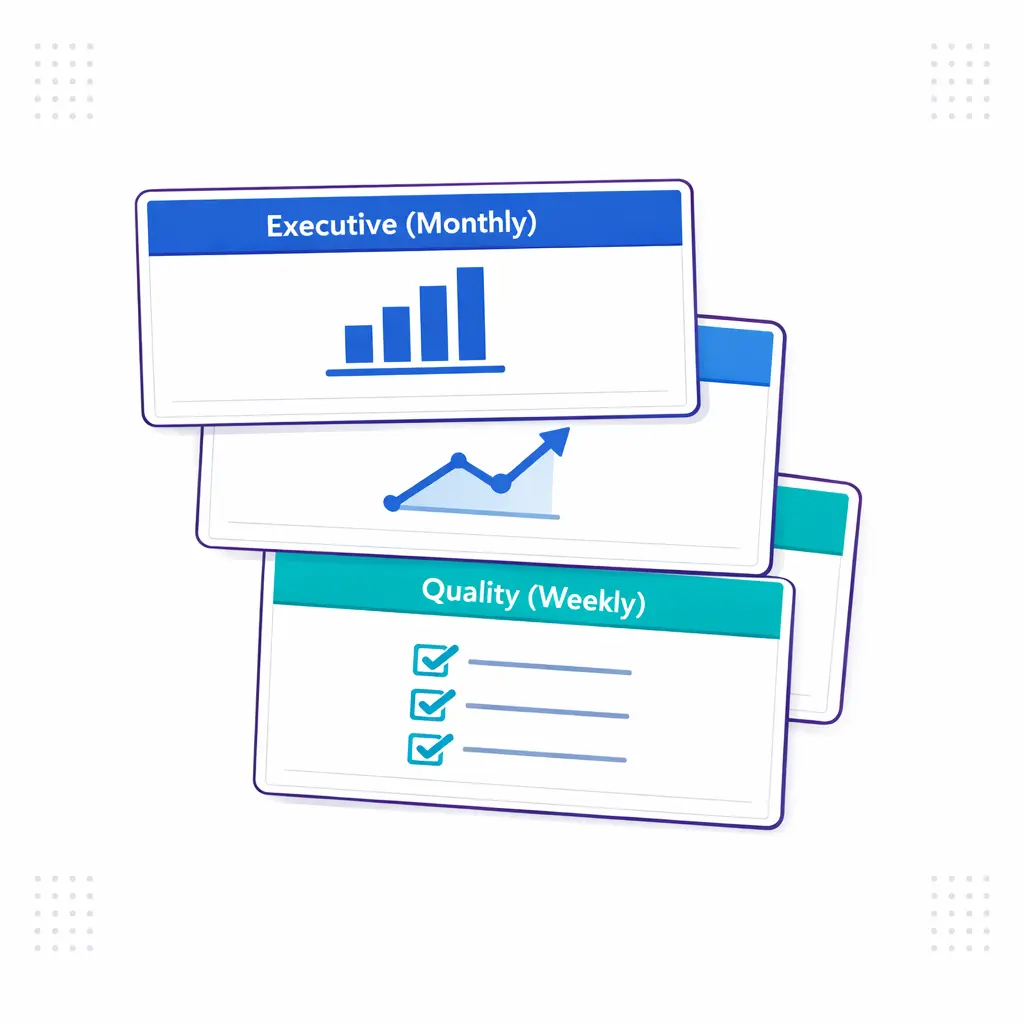
A strong BPO reporting pack separates operational health from revenue impact. It also makes it easy to see whether a problem is coverage, conversion behavior, training/QA, or systems/data.
Executive view (monthly): volume, connect rate, qualified intake rate, conversion rate, unit economics, top loss reasons
Ops view (weekly): speed to lead percentiles, missed call recovery performance, staffing vs demand, routing issues
Quality view (weekly): QA scorecard trends, calibration agreement, top coaching opportunities tied to outcomes
Channel view (monthly): performance by campaign/source, by location group, and by intent type
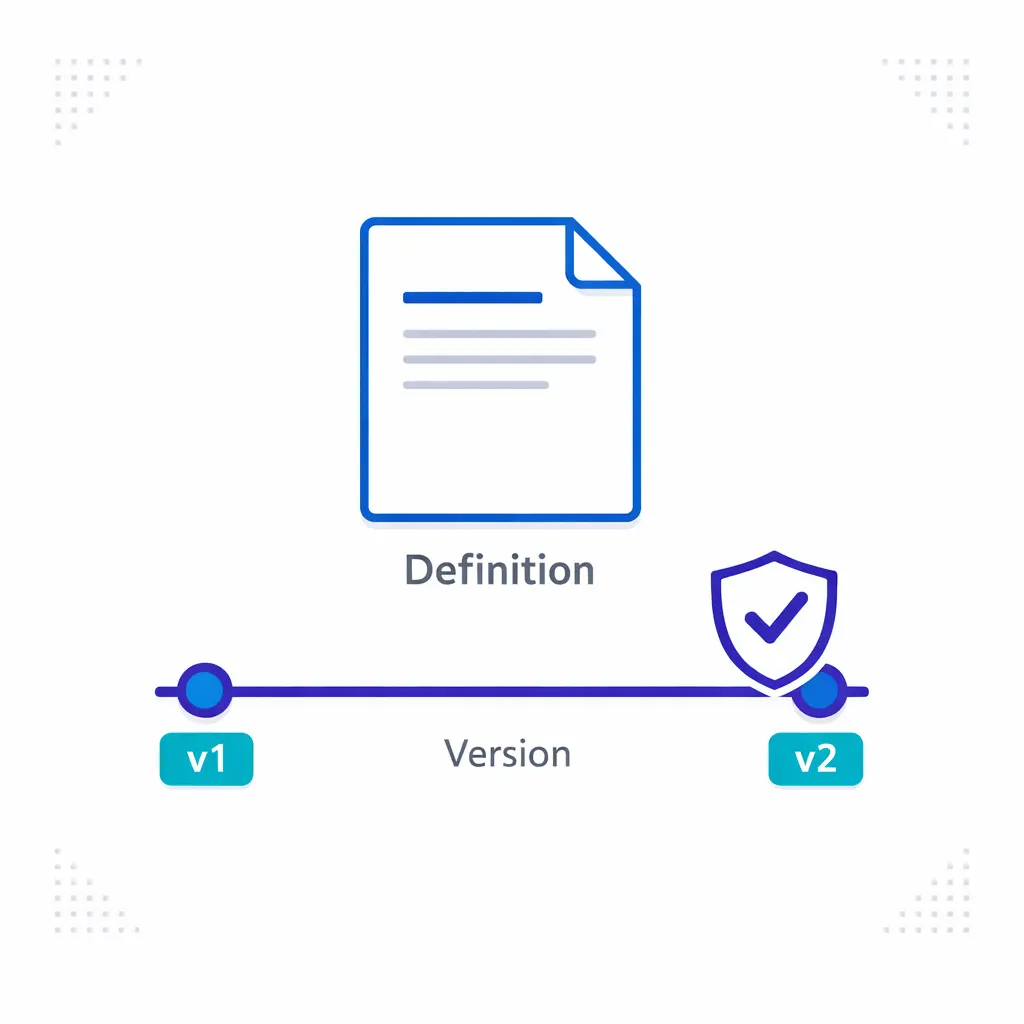
To keep reporting honest, require a small set of “auditable” definitions that never change silently. When definitions must change, version them and annotate your trend lines so leaders do not draw the wrong conclusions.
Define the revenue event for each call type (booked, retained, paid, resolved) and the time window for attribution.
Set a disposition taxonomy that maps cleanly to those events, then measure disposition accuracy with weekly audits.
Instrument speed to lead for missed calls, voicemails, and web leads, tracking percentiles and not just averages.
Build a QA scorecard that weights intake accuracy and conversion behaviors, then calibrate scorers weekly.
Add missed call recovery KPIs (attempt rate, time to attempt, conversion rate) and review them by hour-of-day.
Segment reporting by new vs existing, business hours vs after-hours, and top intent categories.
Connect unit economics to outcomes: cost per qualified intake, cost per conversion, and (when possible) revenue per staffed hour.
If you are evaluating an enterprise BPO partner and want reporting that connects coverage to real revenue outcomes, Go Answer can help you design a KPI system that holds up across locations, campaigns, and after-hours workflows. To discuss your call center KPI stack, QA scorecard design, and the BPO reporting pack your leadership team will actually use, you can Request Pricing from Go Answer or ask about options to Book a Discovery Call, Talk to a Specialist, Explore Enterprise BPO, See How It Works, or View Use Cases.
Learn why thousands of companies rely on Go Answer.
Try us risk-free for 14 days!
Enjoy our risk-free trial for 14 days or 200 minutes, whichever comes first.
Have more questions? Call us at 888-462-6793
Learn why thousands of companies rely on Go Answer.
Have more questions? Call us at 888-462-6793
If you would like to get in contact with a Go Answer representative please give us a call, chat or email.

Thanks for your interest!
A representative will be reaching out to you shortly.
Have more questions? call us on 888-462-6793
