
Erlang C Explained: How to Calculate the Agents You Actually Need
By Rob ReynoldsLast modified: November 3, 2026
Voted Top Call Center for 2024 by Forbes
Virtual Receptionists
Save time and money with our virtual receptionists.
AI Receptionist
AI-powered receptionist that answers, routes, and qualifies calls 24/7.
Enterprise Solutions
Solutions designed to scale with your organization’s needs.
Legal Services
Our virtual legal receptionists are experts in legal intake.
Last modified: November 3, 2026
If you are searching for an erlang c calculator, you probably do not need more theory. You need a reliable way to answer a practical question: how many agents should be available in each interval so calls are answered fast enough without overstaffing the day.
This guide is for operations leaders, workforce planners, legal intake teams, clinics, and high-volume inbound businesses that need a simple staffing model they can trust. You will learn what Erlang C does, which inputs matter, how to calculate raw agents versus scheduled headcount, where the model breaks, and when overflow or after-hours coverage makes more sense than adding more seats.
What is an Erlang C calculator? An Erlang C calculator is a staffing model for an inbound queue that estimates how many agents must be available to answer calls within a target time window. It converts volume, average handle time, and service goals into a raw agent requirement, then lets you add shrinkage to build a real schedule.
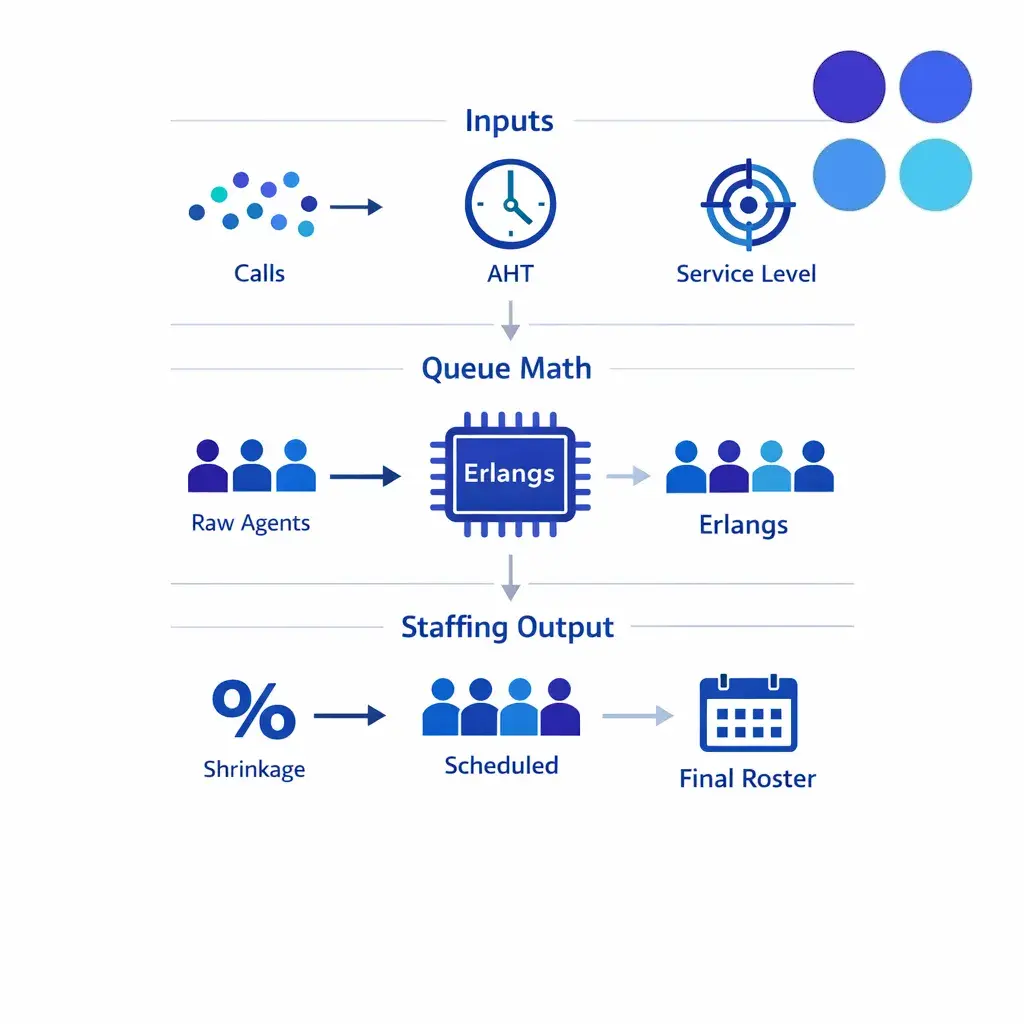
Erlang C starts with call volume, handle time, and service goals and produces a raw agent count. Applying shrinkage to that number gives the scheduled headcount you actually need on the roster for each interval, which is always larger than the raw figure.
If you want the short version, the model takes a few inputs, runs queueing math, and gives you a staffing answer you can act on.
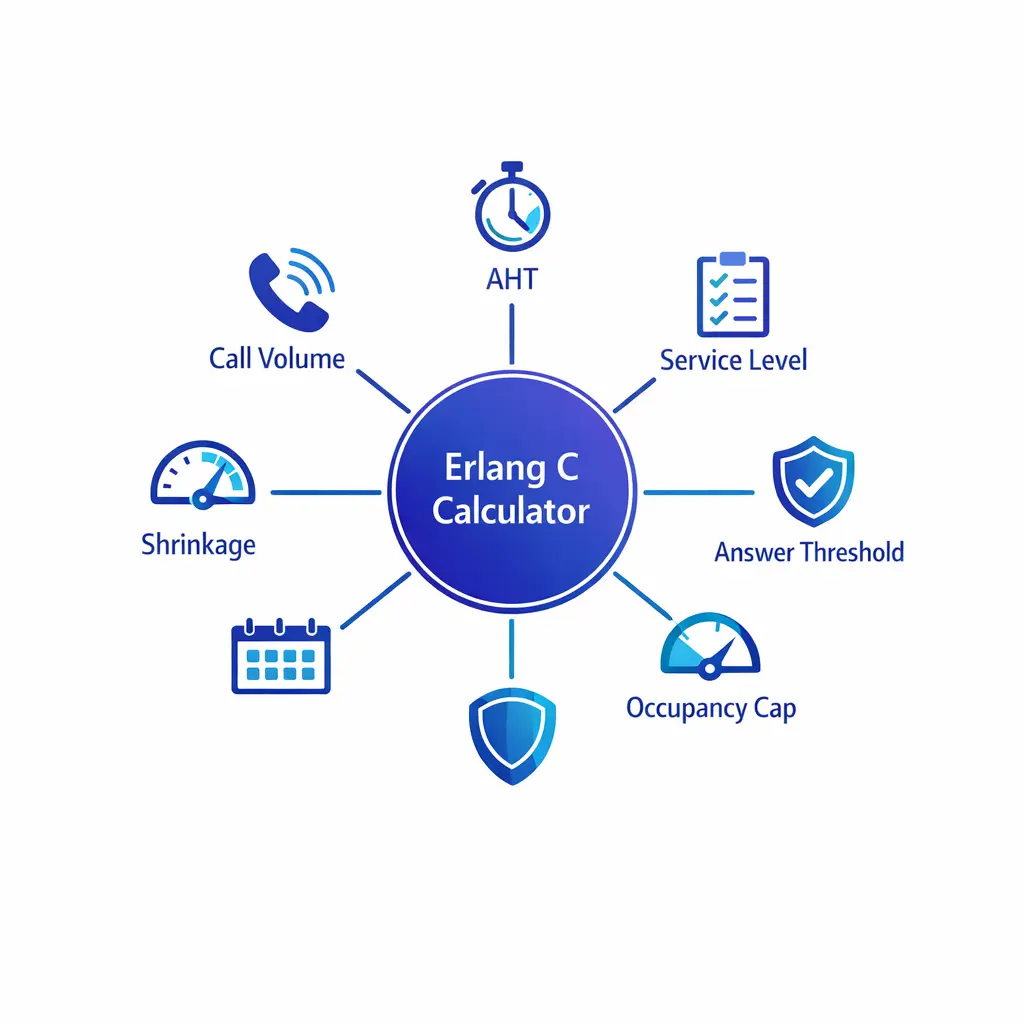
Six inputs drive the model: call volume per interval, average handle time, service-level target, answer-time threshold, shrinkage, and an occupancy cap. Together they determine the raw agent count and the scheduled headcount that follows from it.
An erlang c calculator estimates staffing for inbound call work where customers can wait in line for the next available agent. In plain English, it is best for one queue, one general agent pool, and a service promise such as answering a share of calls within a chosen number of seconds.
The model is most useful when you are planning live answer coverage for business hours, overflow periods, or after-hours peaks. It is less useful when your operation is highly blended across voice, chat, cases, callbacks, and specialist skills that do not behave like one shared queue.
If you compare industry guidance on most Erlang C calculator inputs, you will see the same core fields appear again and again: call volume by interval, AHT, service level, answer threshold, shrinkage, and occupancy. The reason is simple. The staffing answer is only as good as the assumptions you feed into the model.
Use the busiest planning interval, not the daily average. A day with 1,000 calls can be easy to staff or impossible to staff depending on whether demand arrives evenly or in short bursts.
For most inbound teams, 15- or 30-minute intervals are the most useful planning lens. They are short enough to expose spikes and long enough to avoid reacting to pure noise.

A daily average can look calm while a short burst overwhelms the queue. Planning on 15- or 30-minute intervals exposes those spikes, so staffing decisions should use the busiest planning interval rather than the average for the whole day.
AHT should reflect the full agent-occupied time for a call, not just talk time. If your agents spend meaningful time in hold, wrap-up, documentation, or intake notes, include it, because the queue feels all of that time as unavailable capacity.
Use a clean recent average, and separate obvious outliers if they distort the number. In intake-heavy legal and healthcare workflows, one process change can move AHT enough to change staffing by several seats.
Your service level has two parts: the share of calls you want answered and the number of seconds you allow before counting the call as late. A target like 80/20 means you want 80 percent of calls answered within 20 seconds.
That benchmark is a starting point, not a default you should copy blindly. If your leads are high value, your callers are distressed, or your appointments are time sensitive, your target may need to be tighter. If your economics are different, a looser target may be rational.
Shrinkage is the gap between paid time and time that is actually available for handling contacts. Breaks, coaching, meetings, training, absence, and system friction all live here, which is why raw agents and scheduled agents are never the same number.
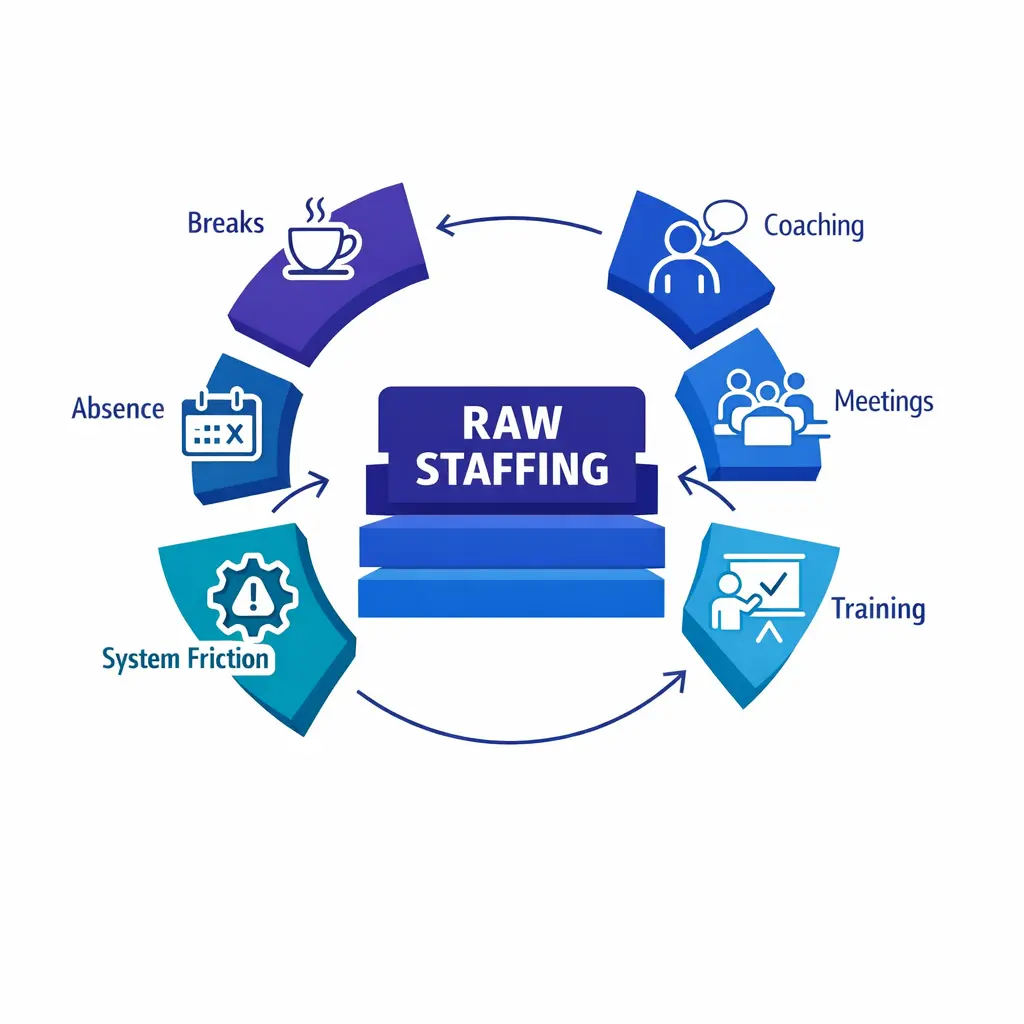
Shrinkage covers breaks, coaching, meetings, training, absence, and system friction. These factors reduce paid time to the time actually available for handling contacts, which is why raw agents and scheduled agents are never the same number.
Occupancy is different. It tells you how busy the available agents are while they are on queue. If occupancy is pushed too high, you may still hit the math on paper while quality, stamina, and schedule resilience deteriorate in real operations.
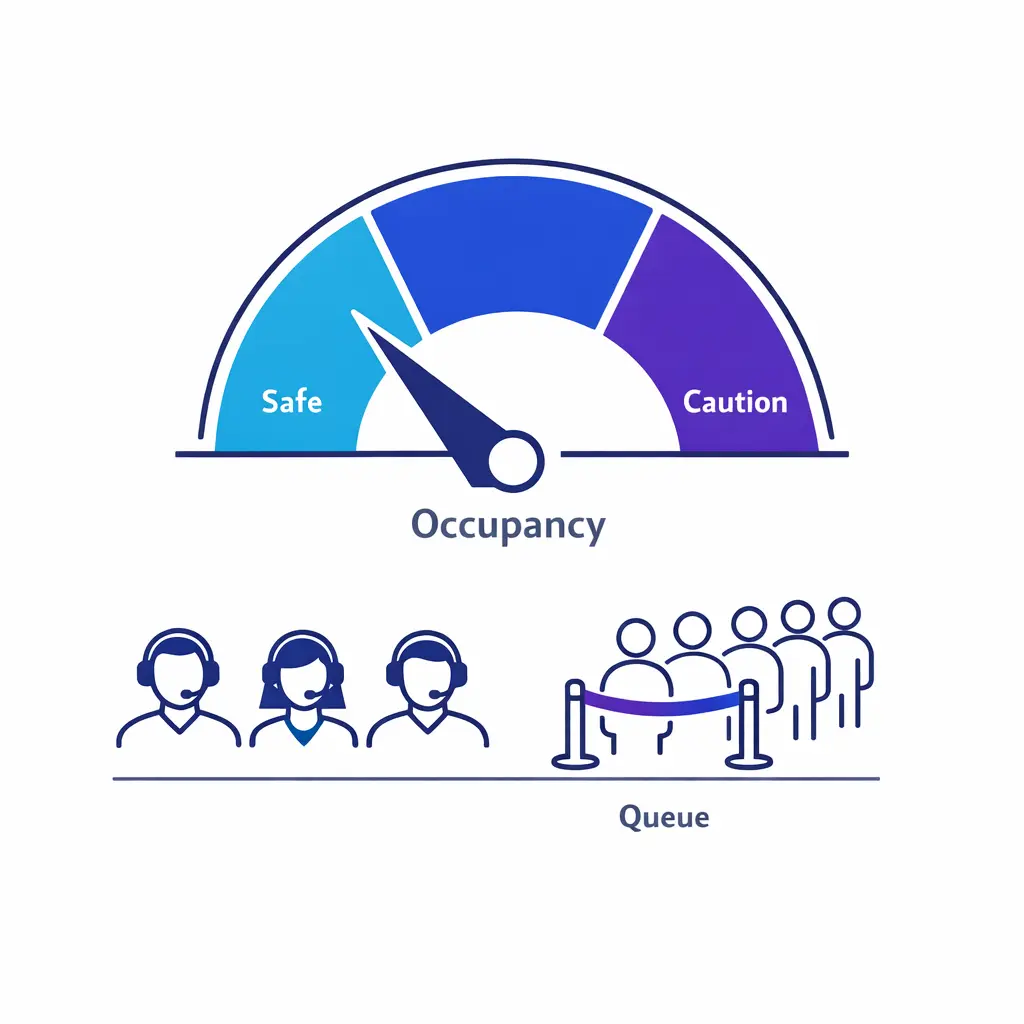
Occupancy shows how busy available agents are while on queue. Pushing it too high may satisfy the math on paper, but quality, stamina, and schedule resilience suffer, so set a cap such as 85 percent to keep the team sustainable.
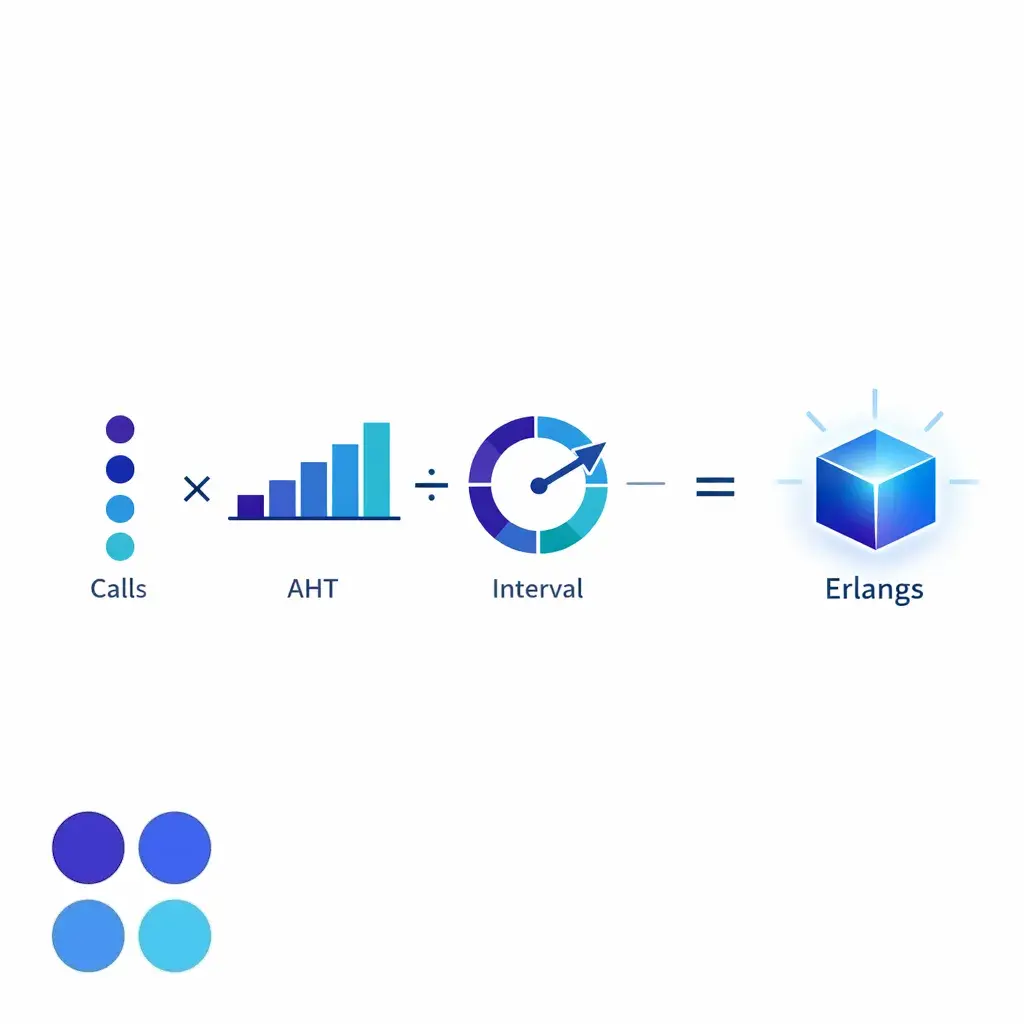
The first step is calculating traffic intensity, measured in erlangs. The simple form is:
Erlangs = calls in the interval × AHT in seconds ÷ interval length in seconds.
If you receive 120 calls in 30 minutes and AHT is 300 seconds, the load is 120 × 300 ÷ 1,800 = 20 erlangs. Think of that as 20 full-time agents worth of work arriving during that interval before you worry about waiting time or service targets.
Erlang C then estimates how likely it is that a caller will have to wait because every agent is busy when the call arrives. As you add agents above the offered load, that waiting probability falls, often sharply once you move past the tipping point.
This is why staffing rarely scales in a perfectly linear way. Two intervals can have similar volume but different staffing needs if AHT, service goals, or acceptable delay are different.
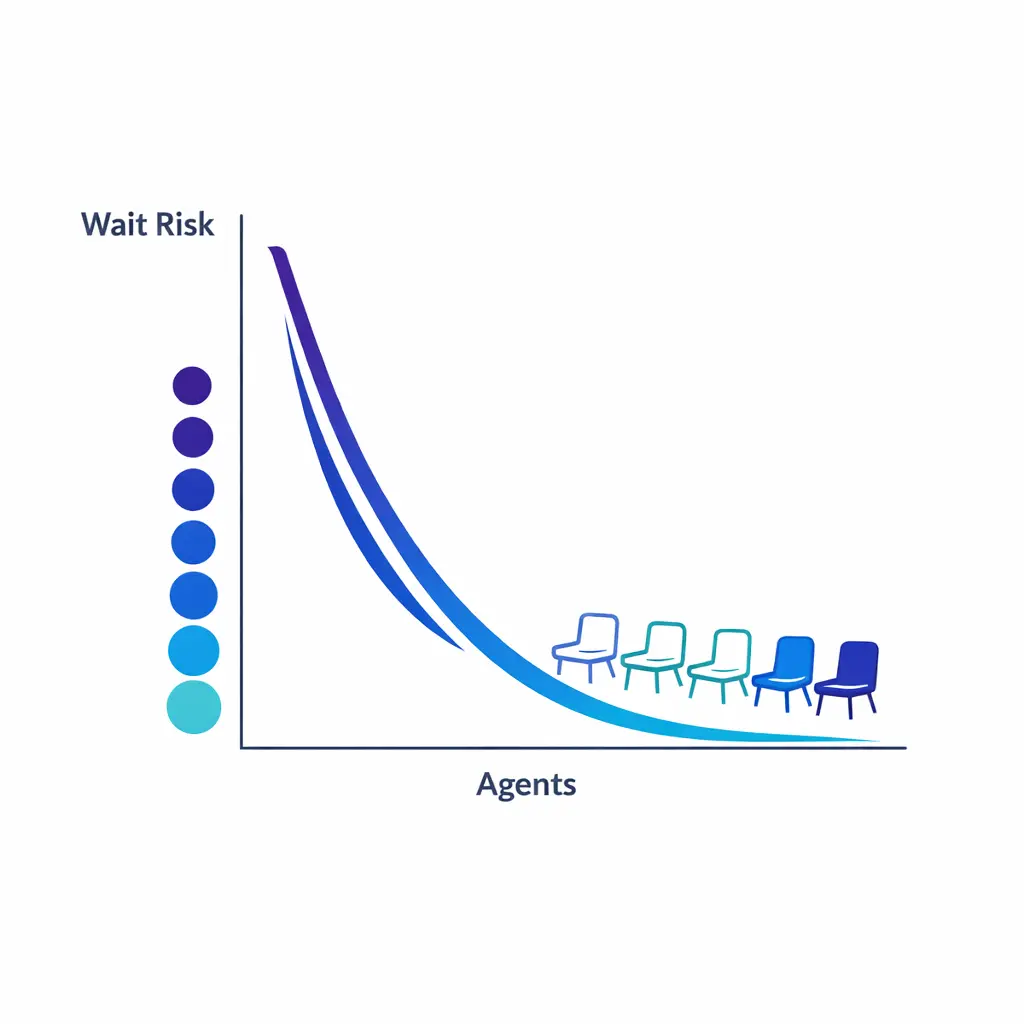
Waiting probability falls as you add agents above the offered load, often sharply past the tipping point. Staffing therefore rarely scales in a straight line, and intervals with similar volume can need different agent counts.
Once you choose an agent count, the model also gives you an expected average speed of answer. That is useful because two schedules can technically pass the same service-level target while still producing very different caller experiences.
ASA is best treated as a companion metric, not the only decision rule. A low average can hide a bad tail if a small share of callers waits far too long.
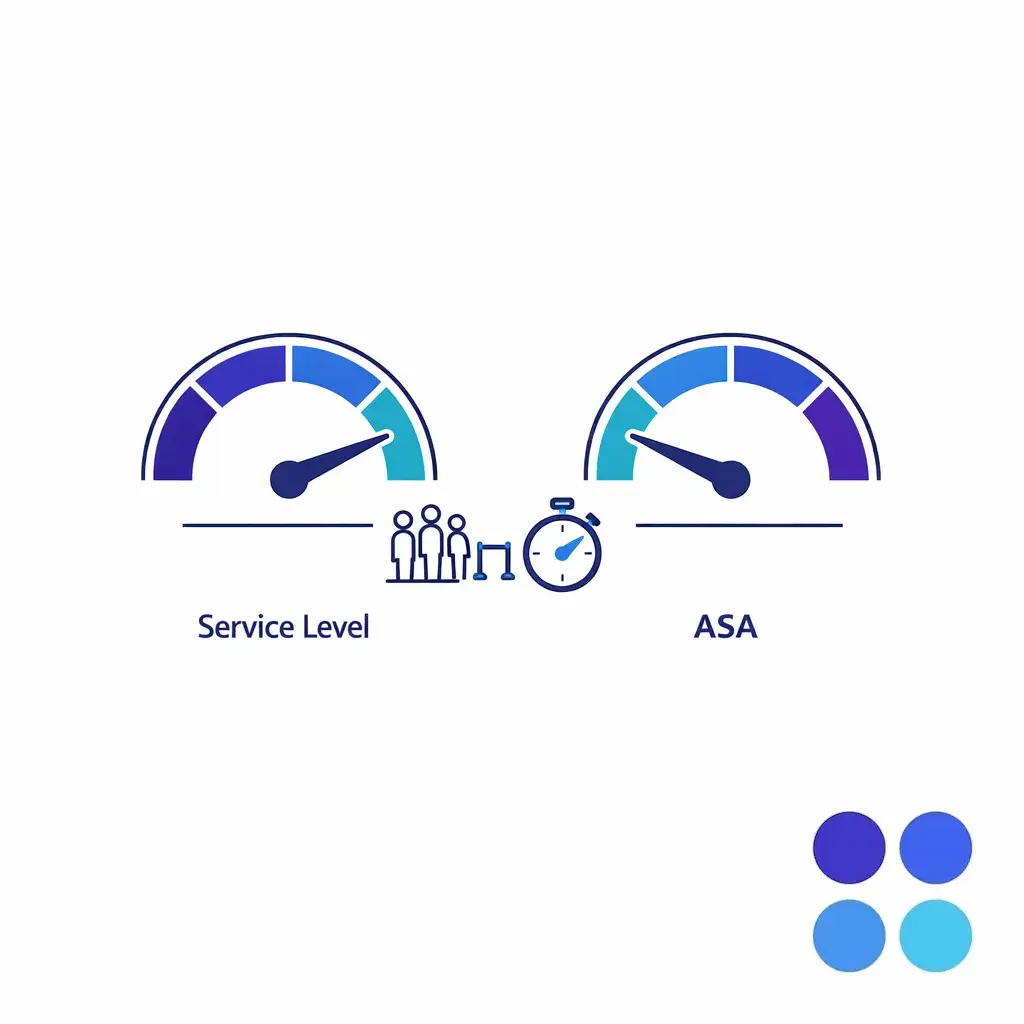
Service level and average speed of answer work as a pair. Two schedules can meet the same service-level target yet give callers very different experiences, so ASA serves best as a companion metric that helps reveal a bad tail of long waits.
In practice, you do not solve this by hand every time. You calculate the workload, test agent counts one by one, and stop when the interval reaches the service-level goal without violating your occupancy ceiling.
That answer is your raw required agents. After that, you divide by one minus shrinkage to get the scheduled headcount you actually need on the roster.
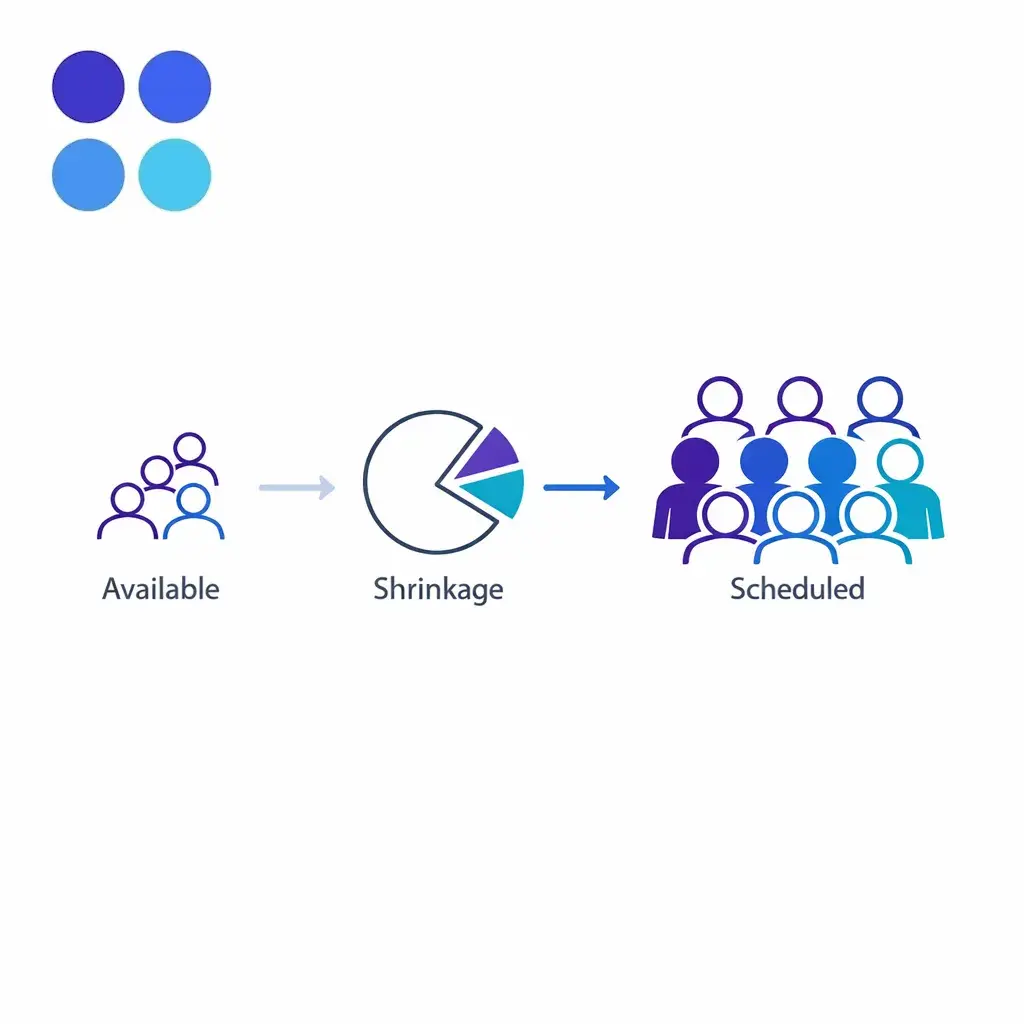
Here is a simple example that shows why an erlang staffing model is only half the story.
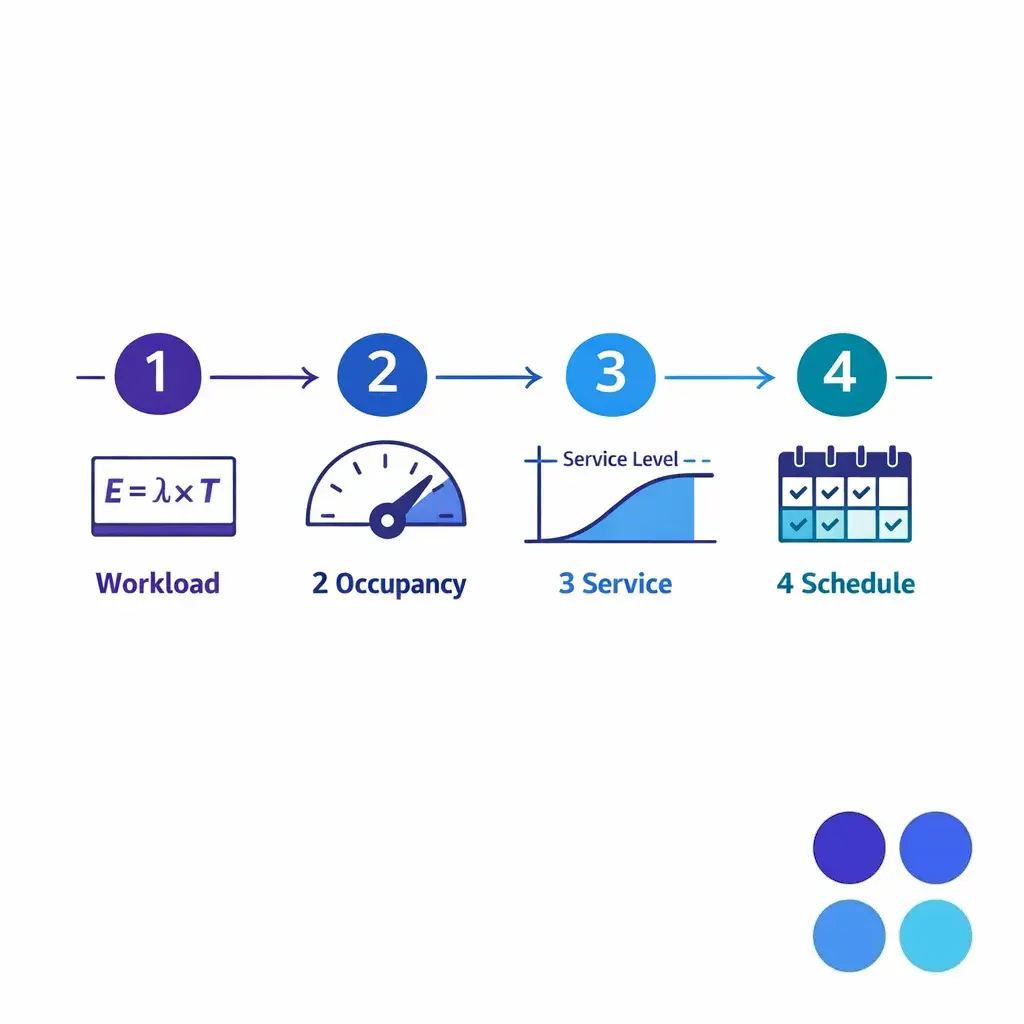
Step 1: Workload in erlangs = 120 × 300 ÷ 1,800 = 20. That means the interval is bringing in the equivalent of 20 fully occupied agents of work.
Step 2: Check the occupancy floor. At an 85 percent cap, the minimum raw agents from occupancy alone is 20 ÷ 0.85 = 23.5, so you need at least 24 available agents before you even test service level.
Step 3: Test the queue target. In this case, 24 agents is still too tight for the 80/20 goal. Moving to 25 available agents brings the interval to about 85 percent answered within 20 seconds, with occupancy at 80 percent and ASA at roughly 12.5 seconds.
Step 4: Convert raw agents into a schedule. With 30 percent shrinkage, scheduled headcount = 25 ÷ 0.70 = 35.7, so the practical answer is 36 scheduled agents.
This is the most common planning mistake. Leaders see “25 agents needed” in a calculator and assume they can schedule 25 people. In reality, 25 is the number you need available in the interval. Once shrinkage is applied, the roster requirement is much higher.
Erlang C is most accurate when the queue behaves like a patient waiting line. If your callers routinely hang up, request callbacks, or switch channels, you may need queueing models that include abandonment and more complex behavior rather than a pure Erlang C view.
That does not make Erlang C useless. It means you should understand what the model is assuming before you trust the answer.
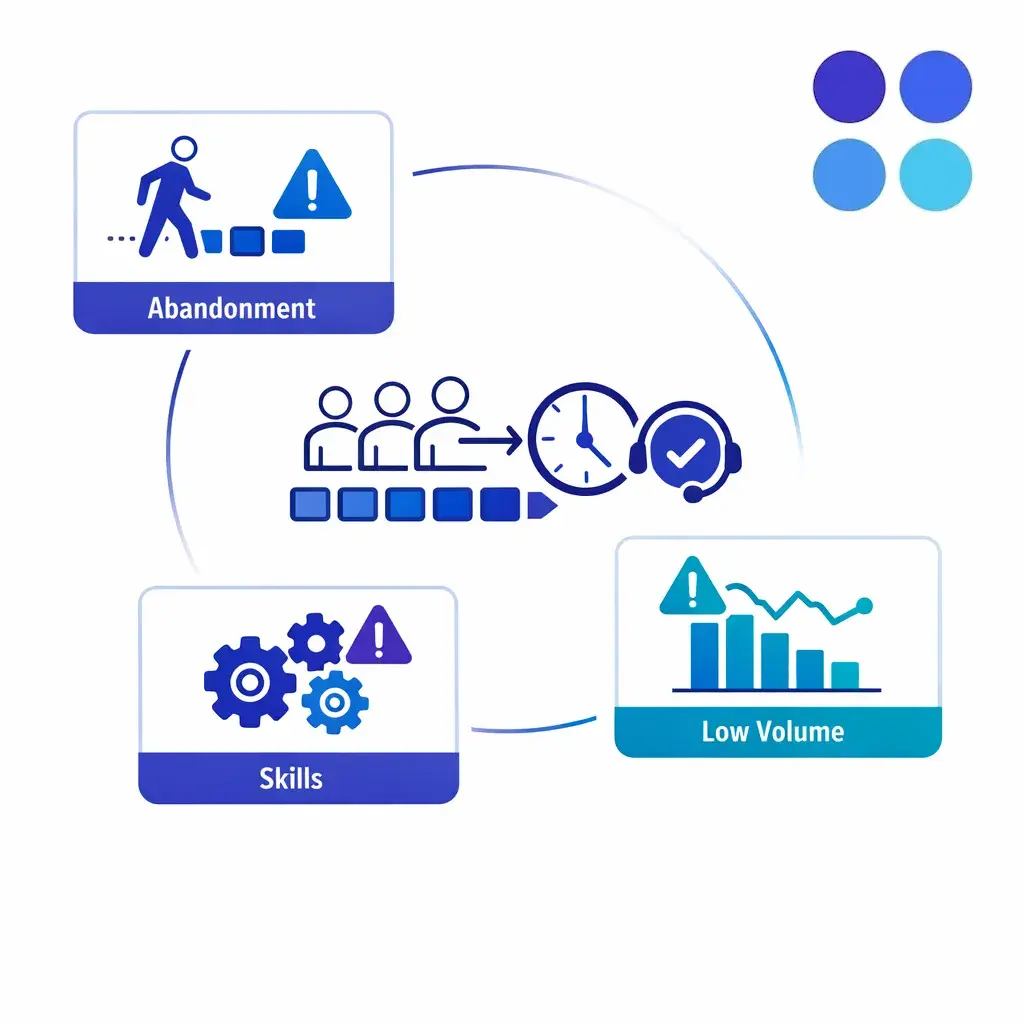
Erlang C assumes patient callers, a single queue, and sizable volume. Abandonment, callbacks, low call counts, and multi-skill or multi-channel work all strain those assumptions, so understand what the model assumes before you trust its answer.
At low call counts, one extra call or one unusually long handle time can swing results sharply. A tiny queue does not average out randomness the way a large queue does, so the staffing answer can look more precise than it really is.
In those cases, use the calculator as a range finder, then validate against actual interval history. Practical staffing judgment matters more when volume is thin.

At low call counts, one extra call or one unusually long handle time can swing the staffing result sharply. A small queue does not average out randomness, so use the calculator as a range finder and validate against interval history.
Erlang C works best for one queue and one broadly interchangeable agent pool. It becomes less reliable when some calls need specialists, some calls must be warm transferred, and some work arrives asynchronously through chat, text, or cases.
If your environment is skill-based and blended, treat the calculator as a baseline for voice demand, not a full operating model for the entire contact center.
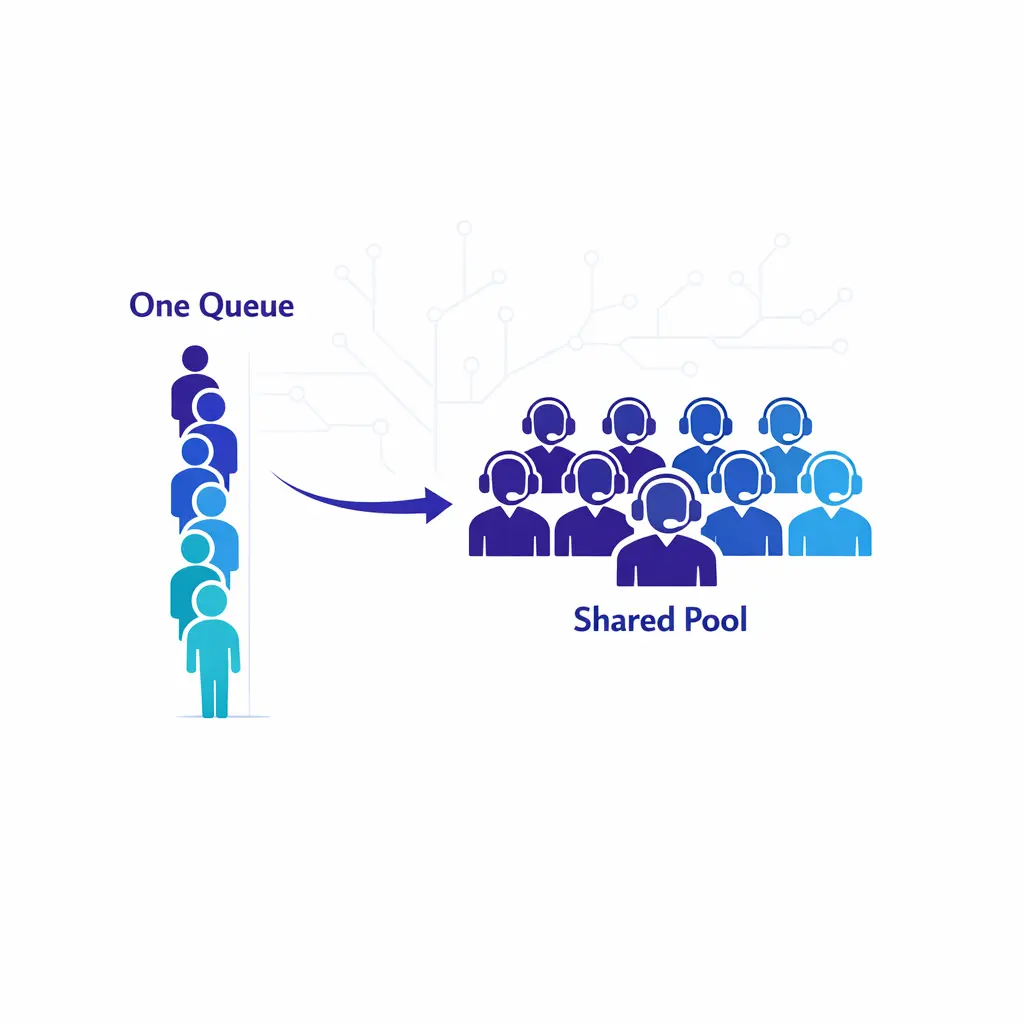
Erlang C works best with one queue and one broadly interchangeable agent pool. Specialist skills, warm transfers, and asynchronous chat or case work add complexity the basic model misses, so treat it as a baseline for voice demand.
Daily averages can hide painful peaks. A center that looks comfortably staffed at the daily level can still miss leads, patients, or urgent callers during a 30-minute surge.
Run the math by interval, then compare the result to real historical arrival patterns. The closer your queue is to the margin, the more intraday planning matters.
These models solve different problems. Erlang C fits queued inbound work, abandonment-aware planning is better when caller patience meaningfully changes outcomes, and Erlang B fits blocked-calls-cleared systems where excess demand gets rejected instead of waiting in line.
If you are asking, “How many agents do I need for inbound calls?” start with Erlang C. If you are asking, “How many lines can I run before callers get a busy signal?” that is an Erlang B question. If caller patience is the real driver, move beyond pure Erlang C.
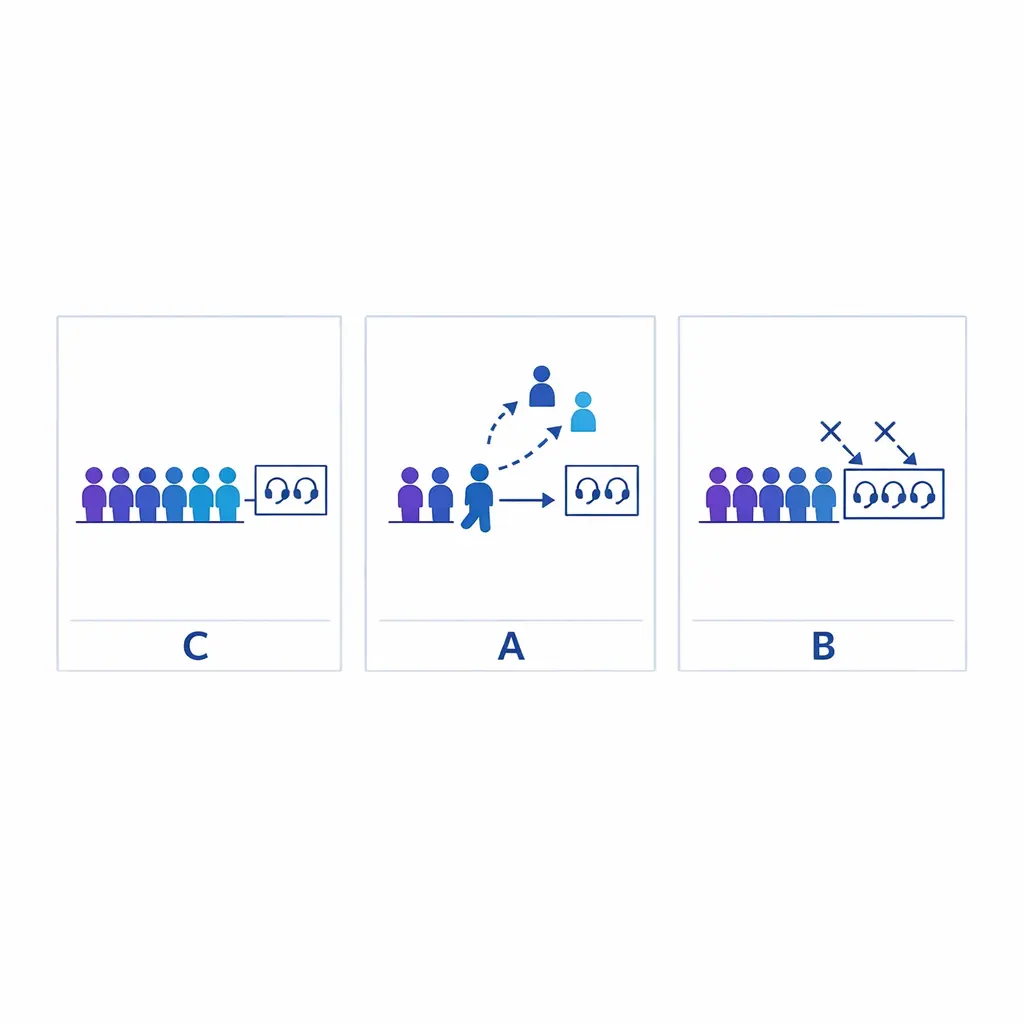
These models solve different problems. Erlang C fits queued inbound calls with a service-level target, Erlang A fits cases where caller abandonment materially changes outcomes, and Erlang B fits systems where excess calls are blocked and cleared instead of waiting.
The math is useful, but planning errors usually come from the setup, not the formula. A good staffing calculator call center model is only as sound as the assumptions behind it.
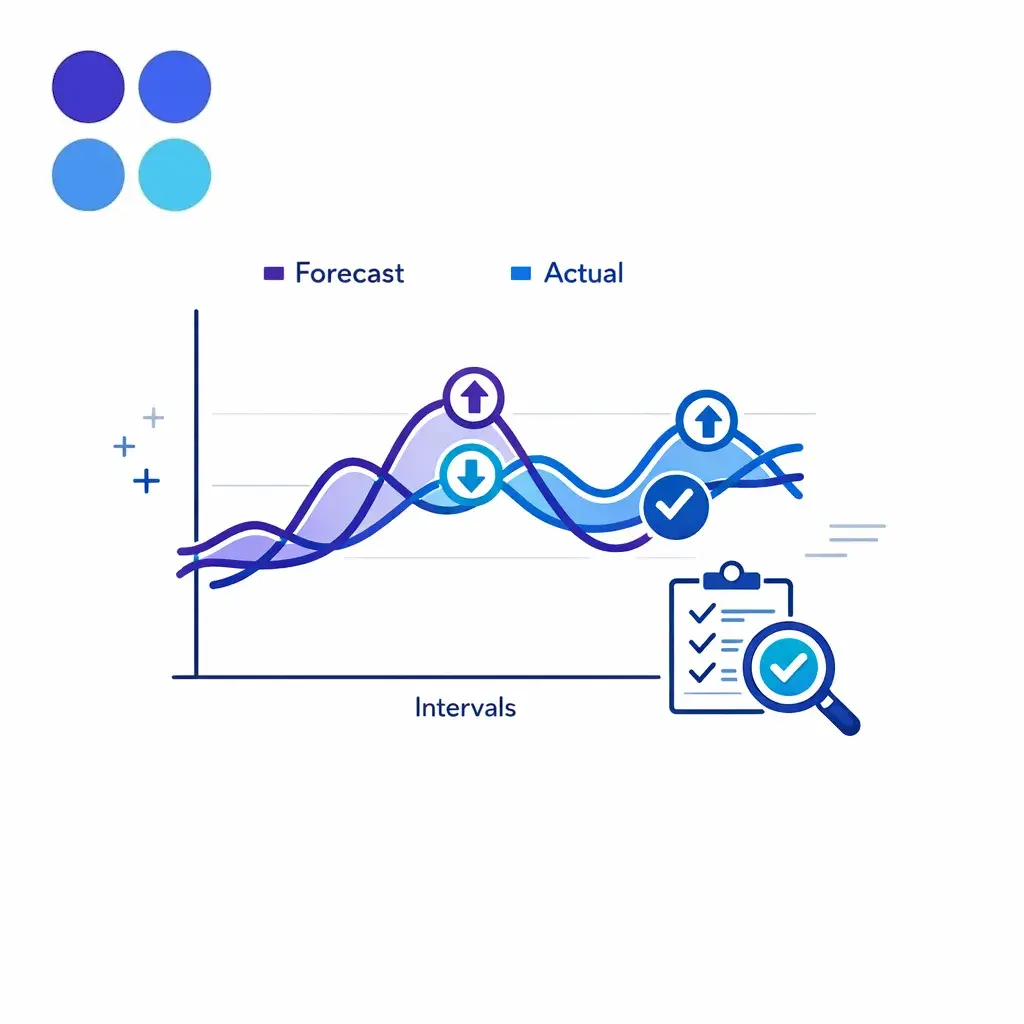
Compare forecasted wait times and staffing outputs against actual intervals. If the model repeatedly misses, the assumptions are wrong even when the math is right, so tune them using your own interval history before relying on the schedule.
A calculator is the right tool when your main challenge is predictable business-hours staffing. It gives you a solid baseline for how many agents should be available, what occupancy looks like, and where your service level starts to break.
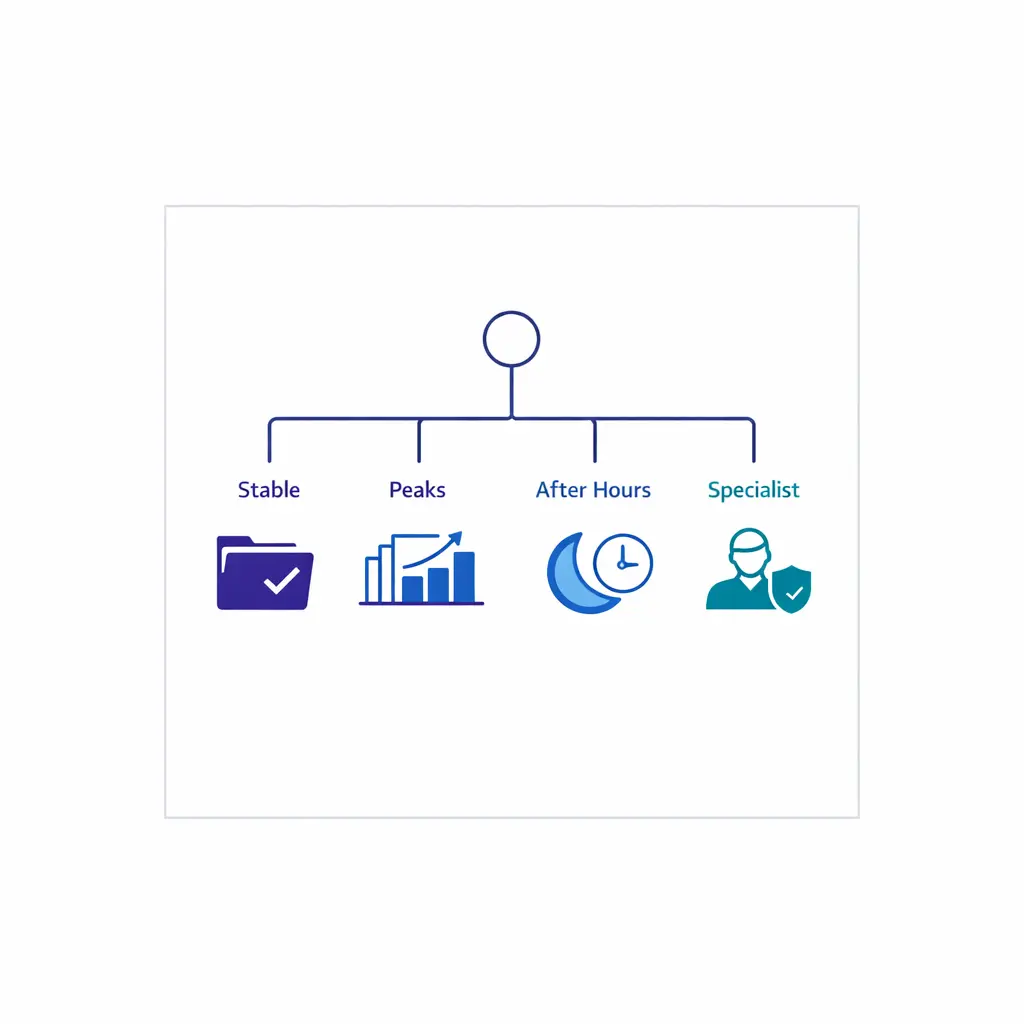
It is not always the best answer when the problem is volatility. If demand spikes are short, after-hours windows are hard to fill, or missed first response has an outsized cost, it can be more efficient to combine core in-house staffing with overflow coverage.

When a few intervals cause most of your misses, permanent seats are an expensive fix. Combining core in-house staffing with overflow coverage absorbs peak demand more efficiently and keeps service levels steadier across the whole day.

Nights, weekends, and holidays are often too costly to staff internally for the volume they bring. After-hours coverage fills that thin-staffing gap so missed first responses stop costing you business.
That is where Go Answer tends to be relevant. For multi-location service businesses, legal intake teams, and healthcare organizations that cannot afford dropped demand, the decision is often not “calculator or partner.” It is “what should stay in-house, and what should be covered more reliably through overflow or after-hours operations.”
It is a planning tool that converts workload and queue goals into an agent estimate. Teams use it to answer how many agents should be available in each interval, then translate that raw answer into a schedule with shrinkage applied.
It means the target is to answer 80 percent of calls within 20 seconds. It is a common benchmark, but it should be treated as a business decision, not a universal standard.
Start with interval call volume and AHT, convert that workload into erlangs, test agent counts until the service-level goal is met, and then add shrinkage. The raw output answers how many agents must be available. The shrinkage-adjusted output answers how many people must be scheduled.
Start with 168 staffed hours per week for each always-on seat. Divide by your paid hours per full-time employee, then apply the same shrinkage logic you use for interval staffing. That is why one continuously staffed position usually requires several FTE, not one.
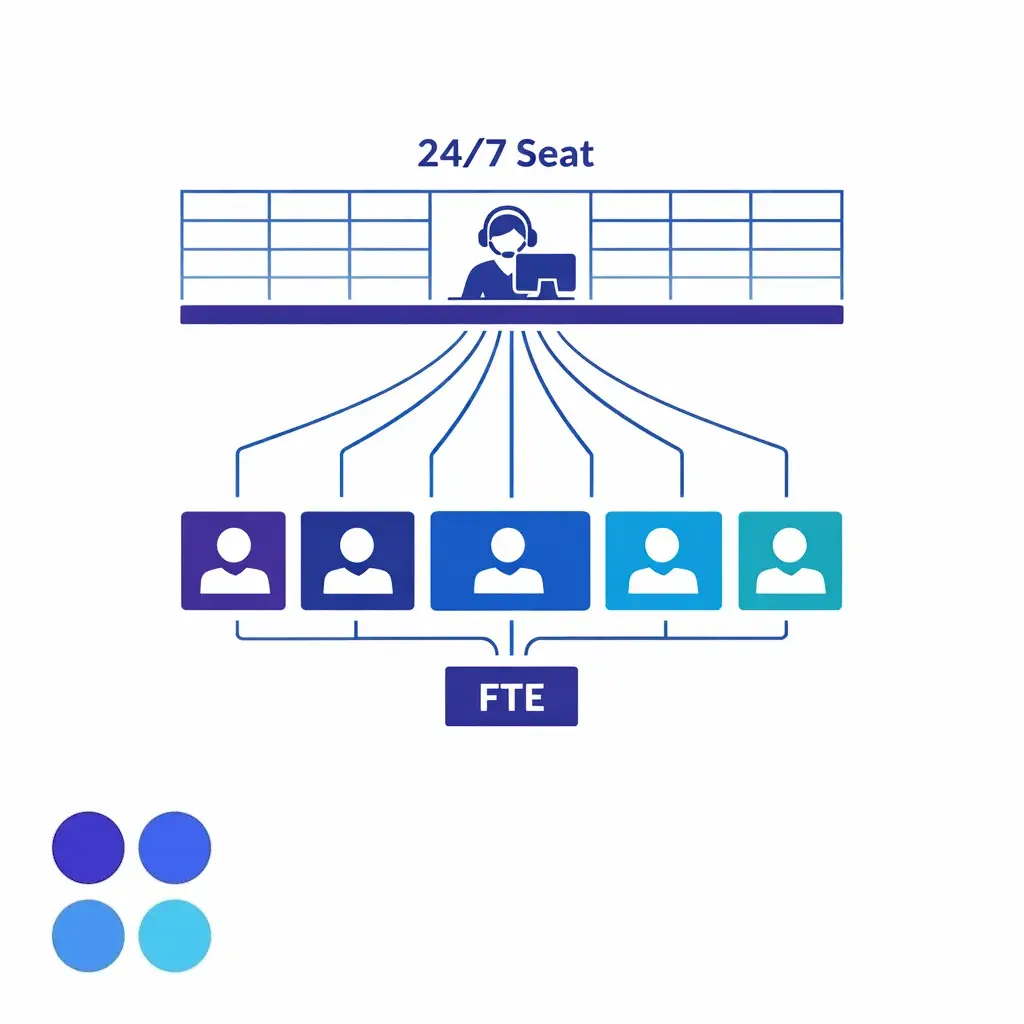
One always-on seat needs 168 staffed hours each week. Dividing by paid hours per full-time employee and applying shrinkage shows that a single continuously staffed position usually requires several FTE rather than one person.
You can build it in a spreadsheet, but most teams use an online erlang c calculator or a locked template because the iterative math is easy to break. If you do use Excel, separate your inputs, raw staffing result, occupancy check, and shrinkage adjustment so the model stays auditable.
If your current staffing model answers volume but not reliability, use Erlang C to size the queue first, then decide where internal staffing ends and overflow support begins. If you want to compare those options for your operation, Go Answer can help you evaluate the tradeoffs clearly.

Use Erlang C to size the queue first, then decide where internal staffing ends and overflow support begins. Comparing staffing math, overflow, and after-hours coverage gives you a coverage plan that matches reality.

Learn why thousands of companies rely on Go Answer.
Try us risk-free for 14 days!
Enjoy our risk-free trial for 14 days or 200 minutes, whichever comes first.
Have more questions? Call us at 888-462-6793
Learn why thousands of companies rely on Go Answer.
Have more questions? Call us at 888-462-6793
If you would like to get in contact with a Go Answer representative please give us a call, chat or email.

Thanks for your interest!
A representative will be reaching out to you shortly.
Have more questions? call us on 888-462-6793
