World-Class Customer Service Metrics: The KPIs Enterprise Teams Should Track Beyond Answer Rate
By Adam AlovisLast modified: September 8, 2026
Voted Top Call Center for 2024 by Forbes
Virtual Receptionists
Save time and money with our virtual receptionists.
AI Receptionist
AI-powered receptionist that answers, routes, and qualifies calls 24/7.
Enterprise Solutions
Solutions designed to scale with your organization’s needs.
Legal Services
Our virtual legal receptionists are experts in legal intake.
Last modified: September 8, 2026
For enterprise teams, a high answer rate can hide real service failures. A line can be answered quickly and still produce a poor intake, a repeat contact, a compliance miss, or a lost appointment.
This guide is for multi-location service businesses, legal intake teams, healthcare groups, and any high-volume inbound operation that needs to manage coverage, quality, and conversion at the same time. You will learn which customer service metrics matter most, how to calculate them, and how executives can use them to manage both internal teams and outsourced vendors.
World-class metrics balance five things at once: access, resolution, quality, compliance, and business outcome, combining classic support measures with intake conversion metrics.
What are world-class customer service metrics? They are the measures that balance five things at once: access, resolution, quality, compliance, and business outcome. In practice, world-class customer service metrics combine classic support measures with intake conversion metrics.
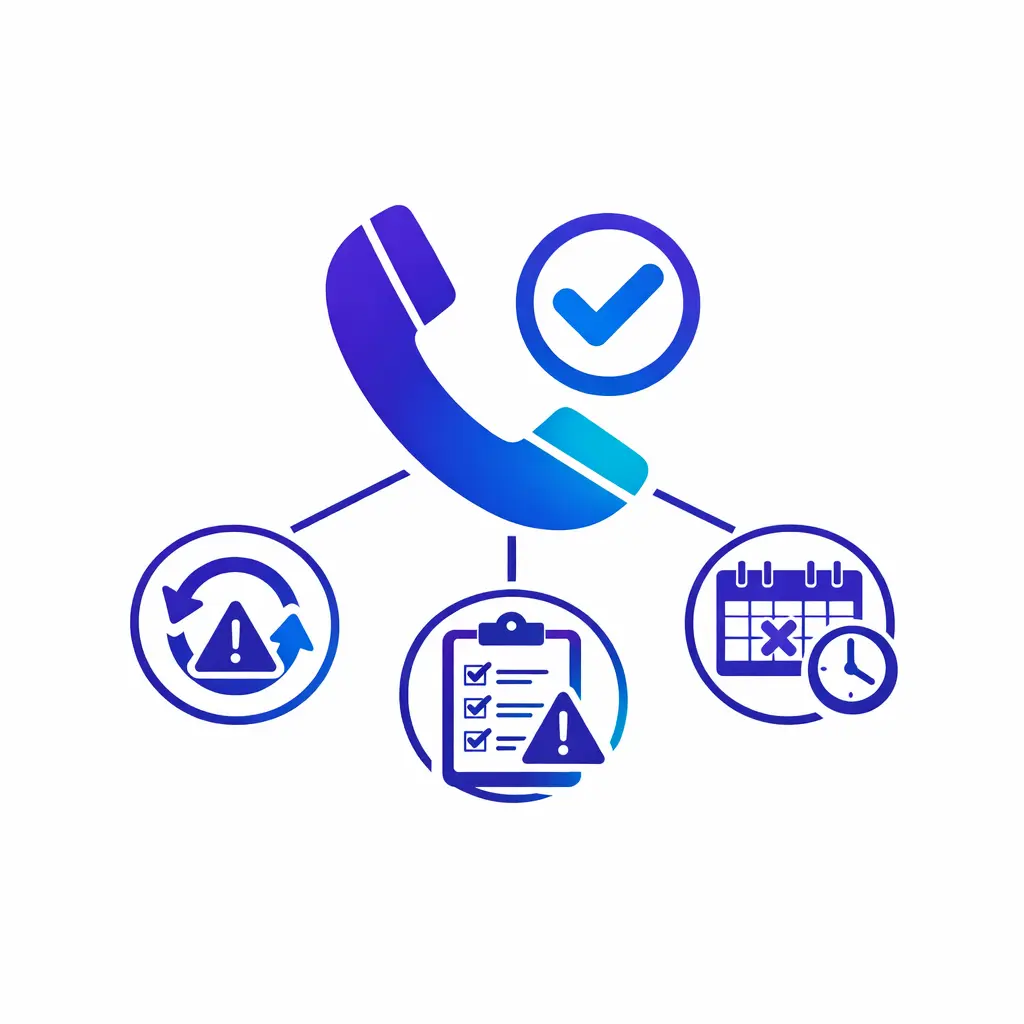
A fast pickup says nothing about whether the wait was acceptable, the issue was resolved, the caller repeated themselves, or the record was captured accurately.
What are the 4 metrics of customer service? If an executive team wants only four headline numbers, start with first response time, first contact resolution, QA or compliance adherence, and conversion to next step. Those four metrics show speed, outcome, control, and business value.
Speed (first response time), outcome (first contact resolution), control (QA and compliance), and business value (conversion) give leaders a balanced view in four numbers.
Service metrics tell you what the customer or caller experienced in real time. They include speed-to-answer, response delay, abandonment, resolution, and satisfaction.
Call center KPIs go deeper into the engine room. They often include staffing efficiency, handle time, occupancy, schedule adherence, and queue performance. Those measures matter, but they are not enough on their own for an executive review.
An executive scorecard should roll the operation up into a small set of measures that show access, quality, risk, and economic output. In most enterprise environments, that means combining classic service metrics with intake conversion metrics and a few governance checks tied to your SLA, operating playbook, or vendor contract.
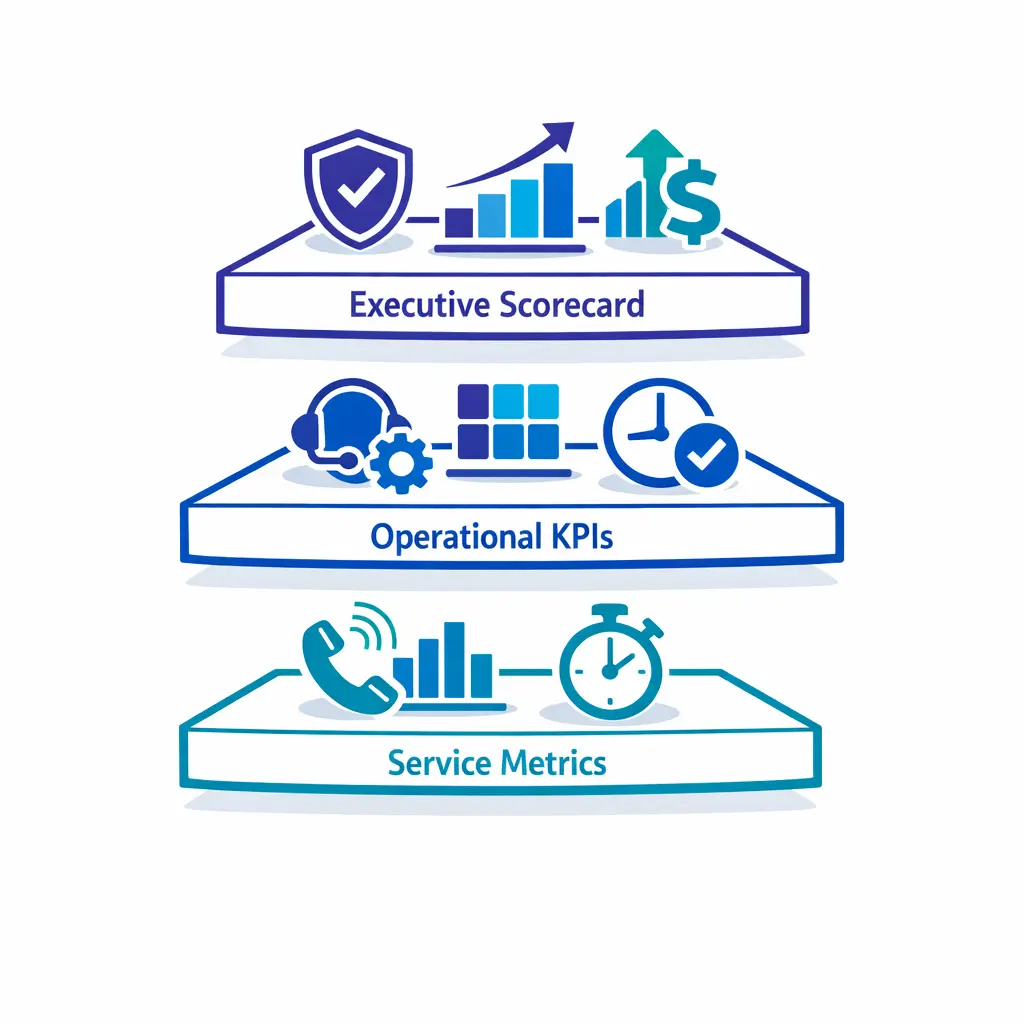
Service metrics, call center KPIs, and executive scorecards are not the same. Leadership needs the top layer that shows access, quality, risk, and economic output together.
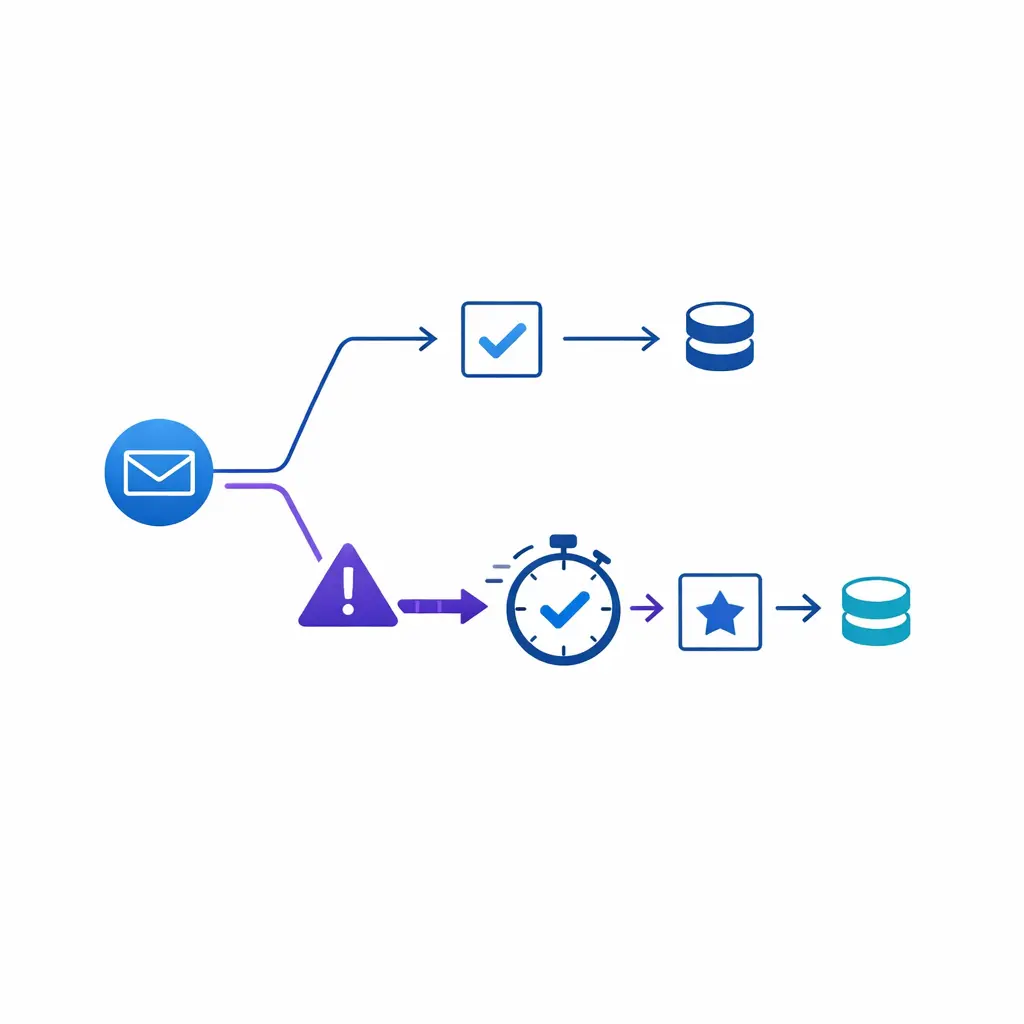
Answer rate only tells you whether contacts were eventually picked up. It does not tell you whether the wait was acceptable, whether the issue was resolved, whether the caller had to repeat themselves, or whether the agent captured the information accurately.
In legal and healthcare workflows, answer rate is especially incomplete. A fast pickup has limited value if the intake is unqualified, the urgent matter is not escalated, or the record is incomplete for the next team.
That is why the best customer service metrics work together. A high answer rate paired with weak FCR, poor QA, or low conversion usually signals a system that is optimized for speed but not for outcome.
FRT measures time to first human response on tickets, chats, forms, and callbacks. If it rises after hours, you have a coverage problem even when daytime answer rate looks fine.
The old scorecard usually stopped at answer rate, average handle time, and a single satisfaction measure. The newer scorecard goes further by separating access metrics from resolution metrics, then connecting both to quality and intake outcome.
That shift matters because many enterprise teams no longer operate in one queue or one channel. They manage voice, chat, form submissions, callbacks, overflow traffic, and after-hours demand, so leadership needs one reporting view that shows not just activity, but the quality of the next step created by that activity.
FCR tells you whether the customer had to come back for the same issue. High FCR usually means scripts, authority levels, routing, and knowledge are aligned.
Most mature programs blend service level, queue answer time, abandoned contacts, and average handle time with first response time, first contact resolution, average resolution time, CSAT, CES, and NPS. The point is not to create a long dashboard. The point is to connect a small number of metrics to a clear operating decision.
First response time, or FRT, measures how long it takes for a person to respond after a contact arrives. It is most useful for tickets, chats, web forms, voicemail callbacks, and omnichannel programs where the first touch is not always a live phone answer.
Use FRT to manage responsiveness across channels and shifts. If FRT rises after hours or on weekends, you have a coverage problem even if daytime phone answer rate still looks good.
Abandonment shows how much demand you failed to retain long enough to serve. Read it alongside time of day and contact reason to find after-hours spikes.
First contact resolution is one of the strongest outcome metrics because it tells you whether the customer needed to come back for the same issue. High FCR usually means your scripts, authority levels, routing logic, and knowledge resources are aligned.
Low FCR can come from several very different problems. The most common are poor discovery, weak handoff notes, inaccurate routing, limited permissions, or an intake process that captures information but does not create a usable next step.
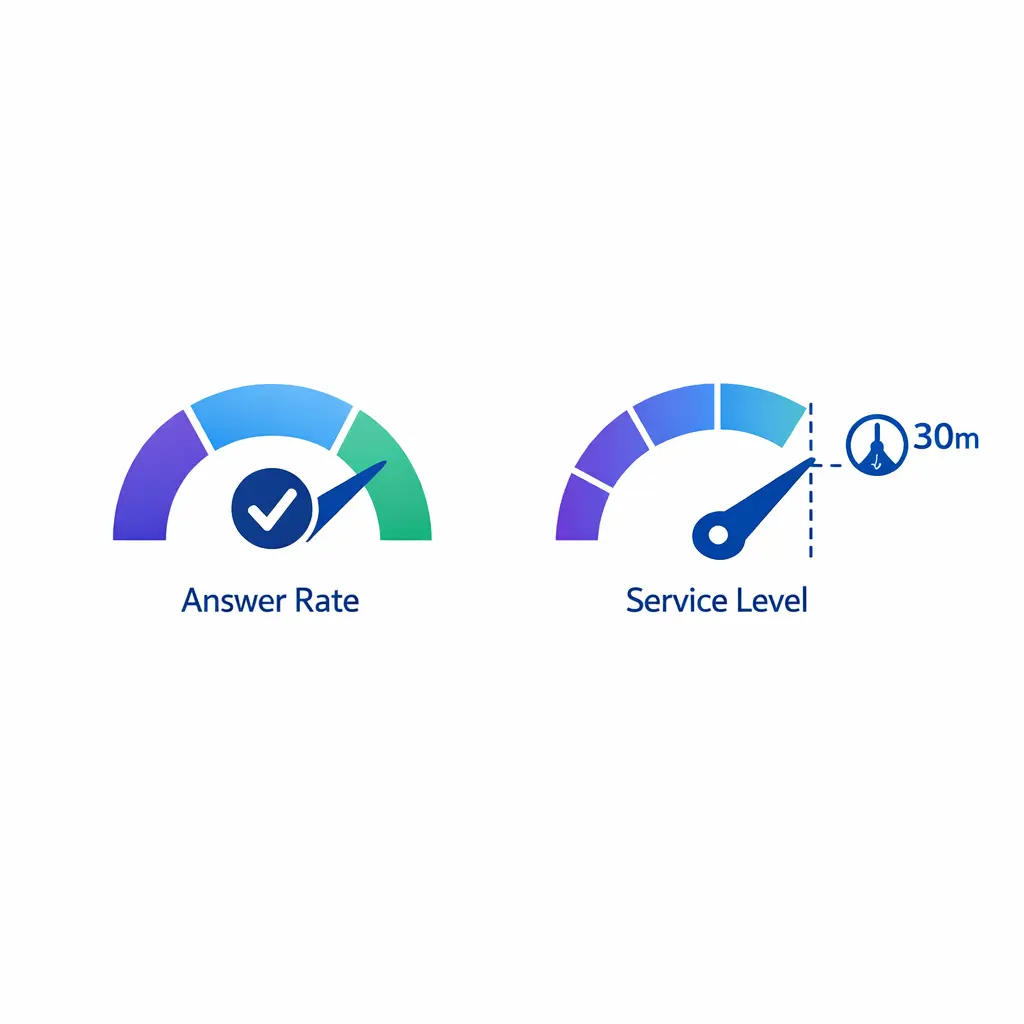
Answer rate asks whether the contact was answered at all; service level asks whether it was answered within the promised threshold. Both matter, but they answer different questions.
Average resolution time measures how long it takes to fully close the request, not just acknowledge it. For enterprise teams, this matters because a fast first response can still mask slow completion.
Track resolution time by contact reason, not only in the aggregate. Billing questions, new-patient scheduling, mass tort screening, and emergency service requests do not belong in the same average.
A world-class scorecard measures whether the interaction was handled the right way, not just the fast way: verification, documentation, disclosures, and escalation, every time.
Abandonment rate shows how much demand you failed to retain long enough to serve. It is one of the cleanest signals that queue design, staffing, callback availability, or IVR flow needs attention.
Look at abandonment alongside time of day and reason for contact. A flat monthly average can hide a sharp after-hours spike that translates directly into missed appointments, lost cases, or frustrated existing customers.
Escalation compliance measures whether contacts that required escalation were routed correctly, on time, and with the right documentation, protecting quality without creating bottlenecks.
Answer rate asks whether the contact was answered at all. Service level asks whether it was answered within the promised threshold. Both matter, but they answer different management questions.
Executives should use answer rate to see if supply matched demand. They should use service level to see if the operation met the customer promise embedded in the service level agreement. A team can post a respectable answer rate while still missing its service level badly if calls are answered too late.
For many inbound programs the real job is a booked appointment, consult, or signed next step. If answer rate rises but conversion falls, the operation is moving faster while producing worse outcomes.
A world-class scorecard always measures whether the interaction was handled the right way, not just the fast way. Your quality assurance scorecard should cover verification, listening, accuracy, documentation quality, required disclosures, next-step clarity, and disposition accuracy.
For regulated or high-risk workflows, QA must include compliance controls. If the interaction should trigger a script element, consent step, privacy safeguard, or escalation path, your scorecard should measure whether it happened every time.
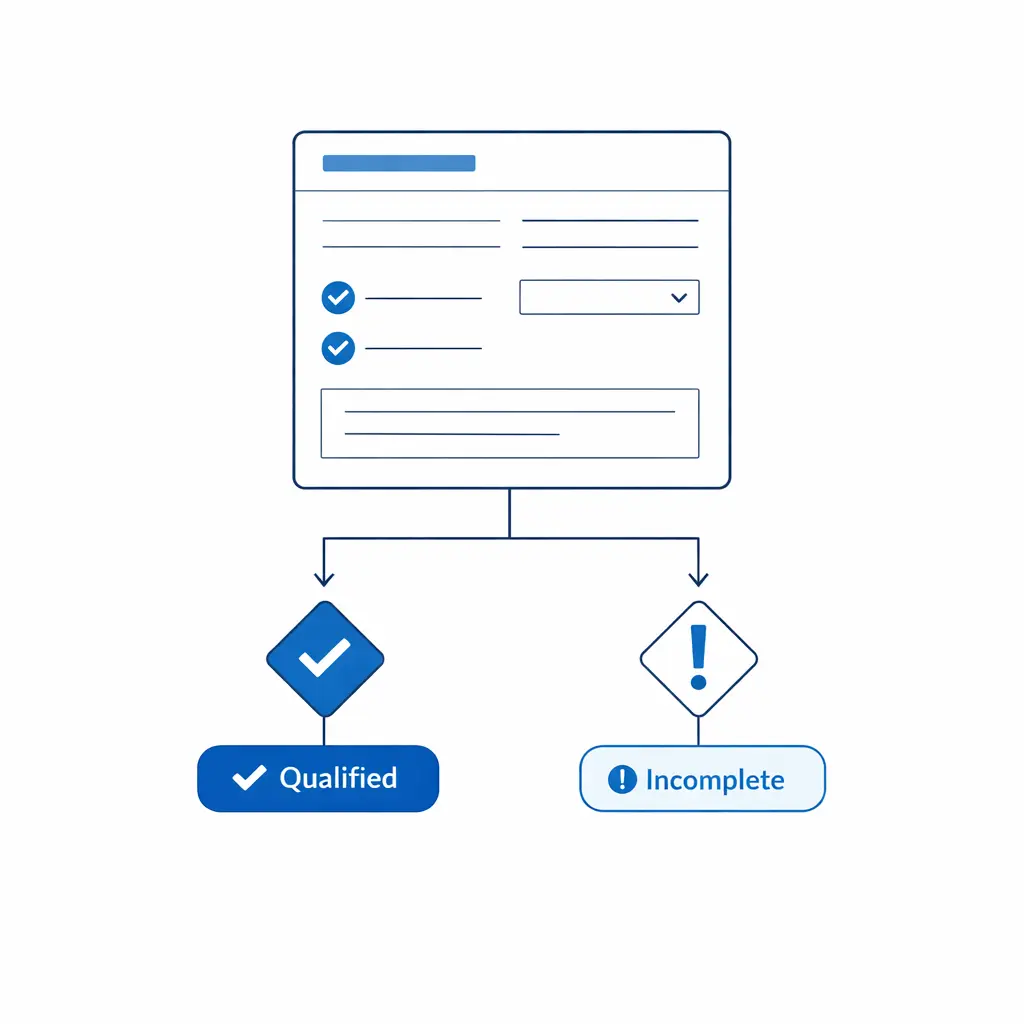
Measure how often an eligible contact becomes a complete, usable intake that meets your acceptance criteria. Define the qualification rule so it is binary enough to audit.
Escalation rate tells you how often contacts are being pushed to a supervisor, specialist, nurse line, attorney review queue, or field team. By itself, that rate is not good or bad. It must be interpreted against contact mix and business rules.
Escalation compliance is the more important metric. It measures whether the contacts that required escalation were escalated within the correct timeframe, with the right documentation, to the right destination. That is how you protect service quality without creating bottlenecks.
Accuracy checks whether the front line classified the opportunity correctly. It reveals whether training and calibration produce consistent decisions across vendors, locations, and shifts.
Experience metrics still matter, but they should sit beside operational measures rather than replace them. Use them to understand whether customers felt satisfied, how easy the interaction was, and whether the brand earned longer-term loyalty.
They are valuable for trend detection and journey design, but they are less useful as stand-alone management tools when response volume is high and the business outcome depends on accurate intake. In high-volume environments, experience metrics work best when read beside FCR, QA, and conversion.
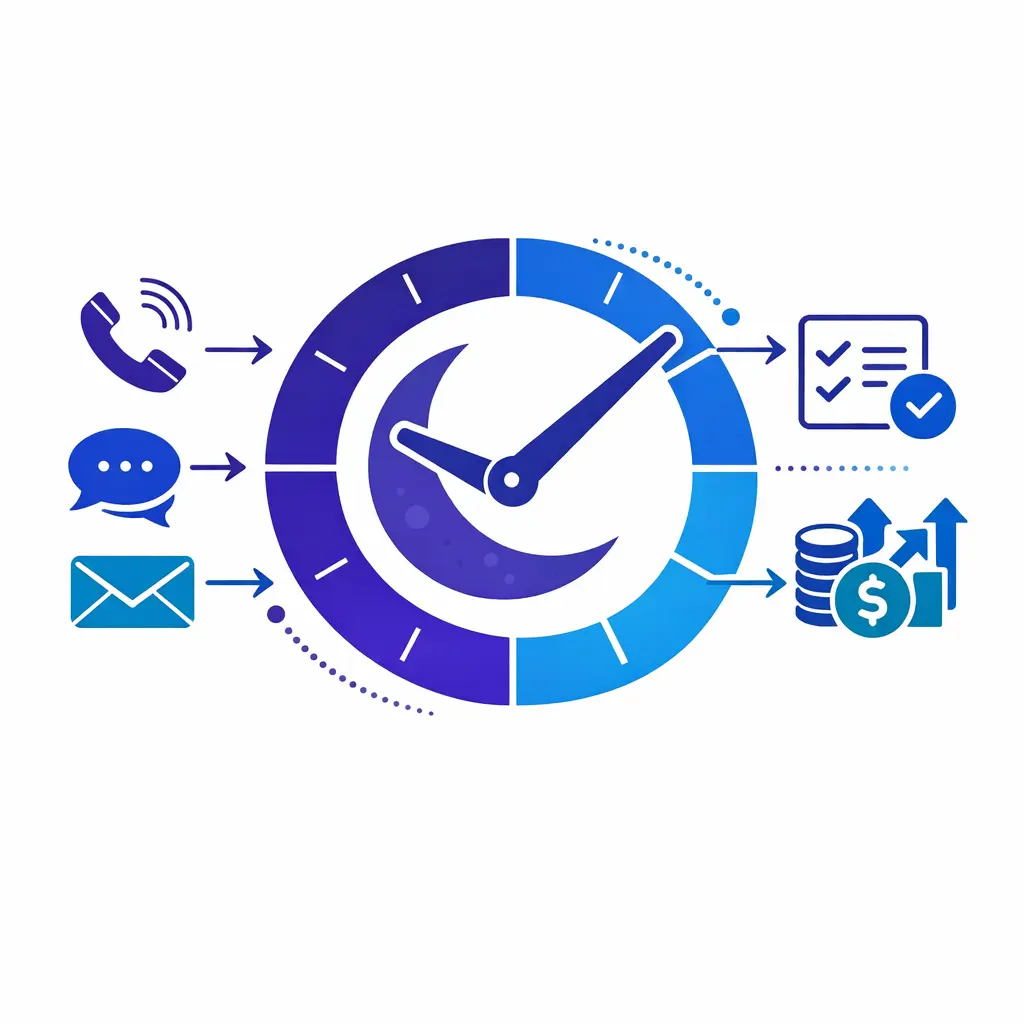
After-hours capture rate measures how much otherwise unavailable demand is actually retained and advanced. Track it separately from daytime performance.
For many inbound programs, the real job is not just answering the call. It is moving the contact to a booked appointment, scheduled consultation, dispatch, signed retainer discussion, or another defined next step.
That is why conversion to appointment belongs on the executive dashboard. If answer rate improves but appointment conversion falls, the operation may be moving faster while producing worse outcomes.
The inverse view: how many eligible contacts did not reach the intended next step because they were abandoned, misrouted, mishandled, or not followed up in time.
Qualified intake rate measures how often an eligible contact becomes a complete, usable intake that meets your acceptance criteria. This is often the missing KPI in legal, healthcare, and complex service workflows.
Define the qualification rule carefully. It might mean conflict screen completed, insurance fields captured, case criteria met, urgency coded, or required documents requested. Whatever the rule is, it should be binary enough to audit.
Lead or intake qualification accuracy checks whether the front-line team classified the opportunity correctly. It is different from conversion rate because a low conversion may still be acceptable if the lead was legitimately unqualified, while a low accuracy rate means the wrong calls are entering or exiting the pipeline.
This KPI is especially useful when multiple vendors, locations, or shifts handle the same script. It reveals whether training and calibration are producing consistent decisions.
Use common contact-center and customer-service definitions so answer rate, service level, FRT, FCR, conversion, and escalation compliance are calculated the same way every time.
After-hours capture rate measures how much otherwise unavailable demand is actually retained and advanced. For many brands, nights, weekends, and overflow periods are where the gap between simple answering and true revenue protection becomes most obvious.
Track this separately from daytime performance. A vendor can look strong in aggregate while leaving a large share of off-hours opportunities unbooked, unqualified, or unreturned.
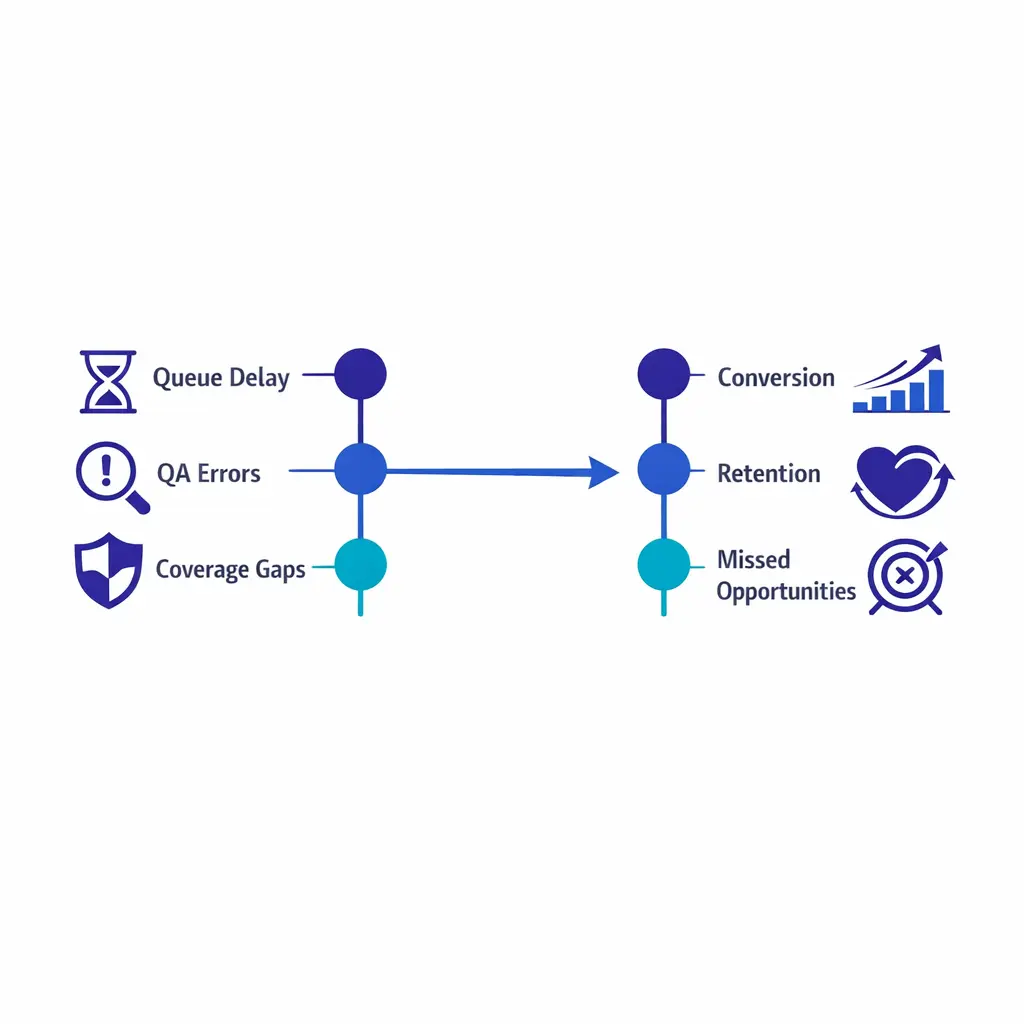
Missed opportunity rate is the inverse view that leaders often need. It asks how many eligible contacts did not reach the intended next step because they were abandoned, misrouted, mishandled, or not followed up in time.
This metric is useful because it translates service failure into business language. It also creates a cleaner bridge between customer service metrics and revenue, retention, acquisition cost, or lifetime value discussions.
Cut every KPI by channel, intent, time band, location, team, and internal vs outsourced coverage to see whether an issue is demand mix, staffing, script, training, or partner performance.
Using common contact-center definitions for answer time, abandoned contacts, service level, and handle time and common customer-service definitions for first response time and first contact resolution, the formulas below give most enterprise teams a practical starting point.
Leading indicators (FRT, queue delay, QA errors, escalation breaches) are levers you can pull today; lagging indicators (CSAT, missed opportunity, retention) show the business effect later.
Never rely on one blended average. Segment at least by channel, contact reason, time band, location, team, and internal versus outsourced coverage.
The minimum practical cut is this:
This is how executives spot whether a KPI issue is caused by demand mix, staffing model, script quality, training, or partner performance.
Weekly dashboards focus on control, monthly on patterns, and quarterly on governance, so the operation is managed at the right altitude at the right cadence.
Operational metrics tell you whether the machine worked. Experience metrics tell you how the interaction felt. You need both, but they should not carry equal weight in every business.
For high-volume inbound teams, operational failure is often the first thing to fix because slow access, poor routing, and incomplete intake can damage the experience before a survey is ever sent. Once the operating basics are stable, experience metrics become more useful as differentiators.
Leading indicators are the metrics you can act on today. They include FRT, queue delay, QA errors, escalation breaches, schedule adherence, and after-hours coverage gaps.
Lagging indicators show the business effect after the fact. They include CSAT trend, missed opportunity rate, retained accounts, appointment show rate, signed matters, and rework. A good dashboard pairs each lagging result with the operational levers most likely to improve it.

Squeezing handle time before resolution is stable trades a week of lower queue pressure for a month of repeats and escalations. Speed only wins when it improves access without harming the next step.
Weekly dashboards should focus on control. Show demand volume, service level, abandonment, FRT, QA sample results, escalation breaches, and after-hours capture by shift.
Monthly dashboards should focus on pattern. Add FCR, average resolution time, conversion to appointment, qualified intake rate, and vendor or site comparisons.
Quarterly reviews should focus on governance. Revisit the service level agreement, the internal operational level agreement, QA calibration, root causes of misses, and whether the scorecard still matches the business priorities of growth, retention, or risk reduction.
Tie at least one metric to revenue. Conversion to appointment, qualified intake rate, and missed opportunity rate connect service performance to bookings, cases, and acquisition cost.
Teams often squeeze handle time or push for faster wrap-up before they have stabilized resolution quality. That can reduce queue pressure for a week while increasing repeats, escalations, and customer frustration for a month.
Speed matters most when it improves access without damaging the next step. If a faster interaction creates more rework, it is not operationally better.
An average can hide a broken tail. A team may show acceptable average response time while one location, one queue, or one overnight block performs far below the promise.
Pair averages with percentiles, time-band views, and exception counts. Also separate new-business contacts from existing-customer service when the business impact is different.
This is the gap that makes many customer service dashboards feel disconnected from the business. If leadership cannot see how missed calls, poor qualification, or slow callbacks affect bookings, case acceptance, renewals, or acquisition cost, the dashboard will be treated as a reporting artifact rather than a management tool.
Build at least one bridge metric between service and revenue. Conversion to appointment, qualified intake rate, and missed opportunity rate are usually the fastest way to create that bridge.
Access, resolution, quality, compliance, commercial outcome, and governance keep a scorecard small enough to review and specific enough to enforce, for internal teams and vendors alike.
A useful scorecard is small enough to review quickly and specific enough to enforce. In most enterprise environments, six categories are enough.
For healthcare programs, the scorecard should reflect the HIPAA Rules where applicable. For legal intake, many teams also calibrate scripts and documentation to ethics duties such as Model Rule 1.6 on confidentiality of information.
Do not copy another company's thresholds blindly. Start with your own baseline, your customer promise, and the true cost of failure by queue or contact type.
Green should mean the target was met without material quality or compliance exceptions. Yellow should mean the metric is drifting or volume mix changed enough to warrant review. Red should mean either the threshold was missed or a high-risk compliance failure occurred, even if the speed metrics looked fine.
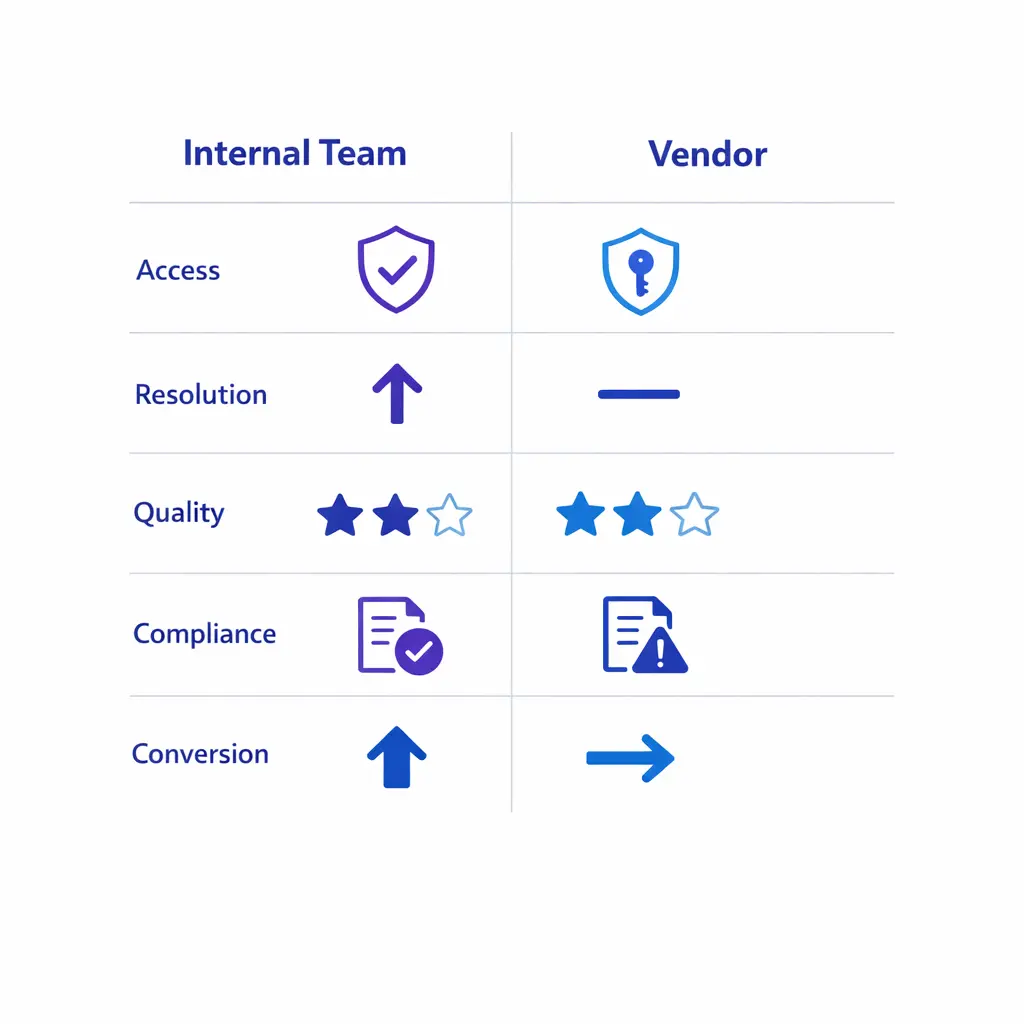
Use the same review rhythm for internal teams and vendors. A partner should be held to the same outcome logic as an internal site: access, quality, compliance, and conversion, not just raw answer rate.
A world-class model brings coverage, QA, escalation control, and conversion into one framework, so internal teams and vendors are measured on outcomes, not just answer rate.
If your team is trying to improve after-hours coverage, intake quality, or vendor accountability, Go Answer can help you design a scorecard that measures what the business actually needs. That includes access, QA, escalation control, and conversion, not just a headline answer rate.
When you are ready to compare options, Request Pricing or Book a Discovery Call. It is a practical way to see how an enterprise answering or intake program should work, review relevant use cases, and talk to a specialist about the right operating model.
Learn why thousands of companies rely on Go Answer.
Try us risk-free for 14 days!
Enjoy our risk-free trial for 14 days or 200 minutes, whichever comes first.
Have more questions? Call us at 888-462-6793
Learn why thousands of companies rely on Go Answer.
Have more questions? Call us at 888-462-6793
If you would like to get in contact with a Go Answer representative please give us a call, chat or email.

Thanks for your interest!
A representative will be reaching out to you shortly.
Have more questions? call us on 888-462-6793
