
Call Abandonment Rate: How to Calculate It and Bring It Down Without Overstaffing
By Eddie FieldsLast modified: November 24, 2026
Voted Top Call Center for 2024 by Forbes
Virtual Receptionists
Save time and money with our virtual receptionists.
AI Receptionist
AI-powered receptionist that answers, routes, and qualifies calls 24/7.
Enterprise Solutions
Solutions designed to scale with your organization’s needs.
Legal Services
Our virtual legal receptionists are experts in legal intake.
Last modified: November 24, 2026
For enterprise service teams, legal intake operations, healthcare practices, and high-volume inbound businesses, a high abandon rate usually means more than a reporting problem. It means missed revenue, delayed response, uneven coverage, and avoidable pressure on the agents who do answer.
This guide is for operators who need a practical way to understand, calculate, and reduce call abandonment rate without defaulting to permanent headcount increases. You will learn what the metric means, how to calculate it cleanly, what a good range looks like, which KPIs drive it, and which tactics lower abandoned calls without creating overstaffing risk.
Call abandonment metrics in contact center reporting track the share of inbound calls that disconnect before an agent answers. In plain terms, the caller tried to reach you, entered the queue or call flow, and hung up before the interaction was completed.
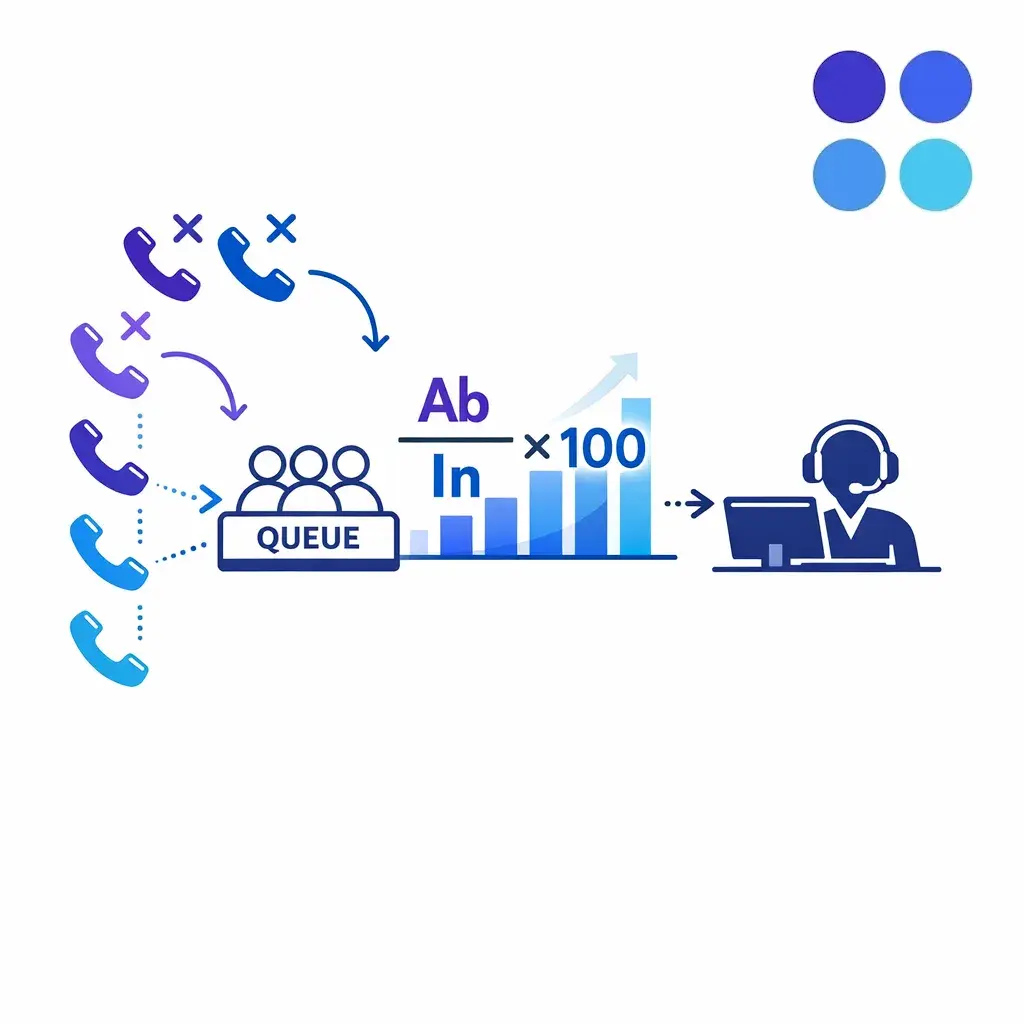
Call abandonment is the share of inbound calls that disconnect before an agent answers. Dividing abandoned calls by total incoming calls gives a simple rate that shows how many callers drop out of the queue before they are helped.
Abandoned calls are the individual calls that end before answer. Call abandonment rate is the percentage built from those abandoned calls over your total incoming call volume.
Operationally, it also helps to separate abandons from calls that fail after connection. If a caller reaches an agent and the line later breaks, that points to a telephony or network issue, not a queue-management issue.
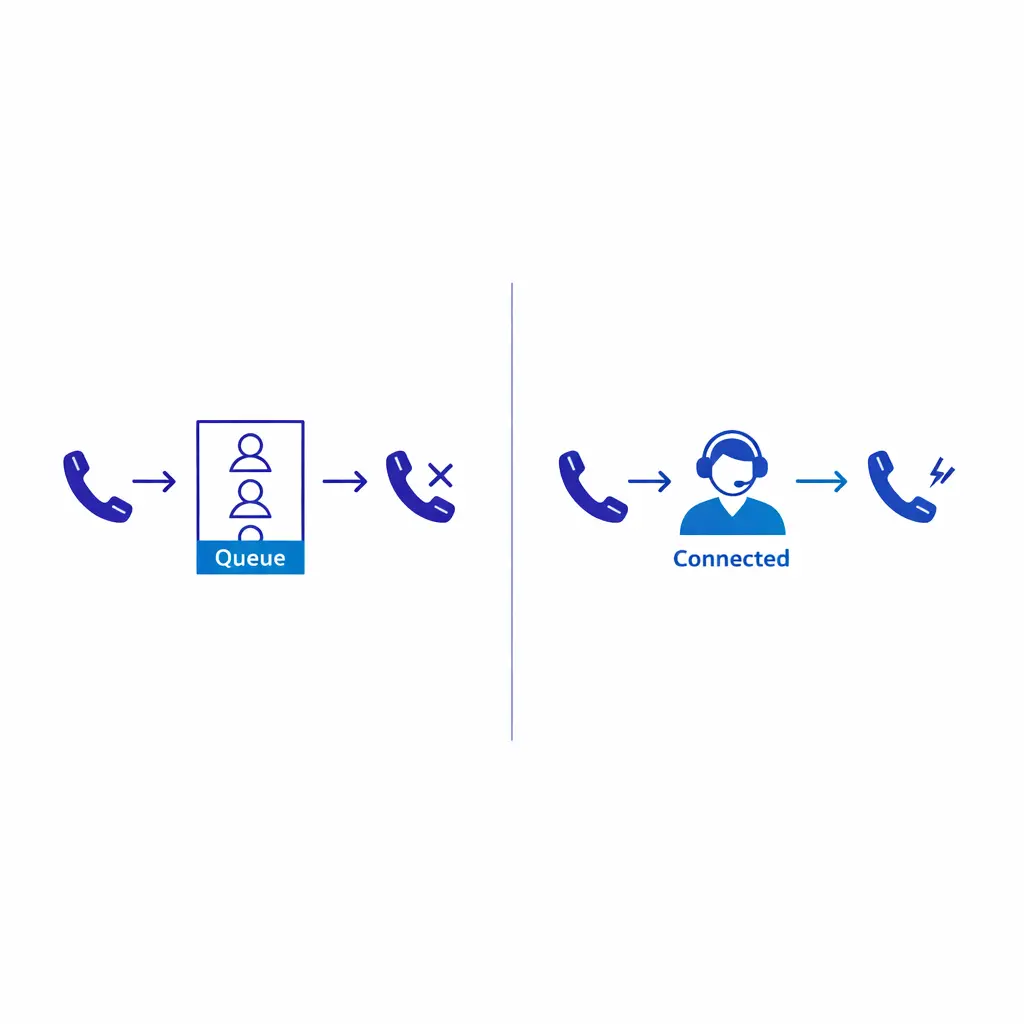
Abandoned calls end before answer, while dropped calls fail after the caller has already connected to an agent. The two look similar in reports but come from different problems, so they should be tracked and fixed separately.
Abandonment is one of the clearest signals that demand is outrunning the experience you are delivering. In legal intake, a caller who gives up may never call back. In healthcare, a delay can push scheduling, triage, or follow-up work into a later shift. In multi-location service businesses, it often shows up first during lunch hours, openings, closings, weather events, and campaign spikes.
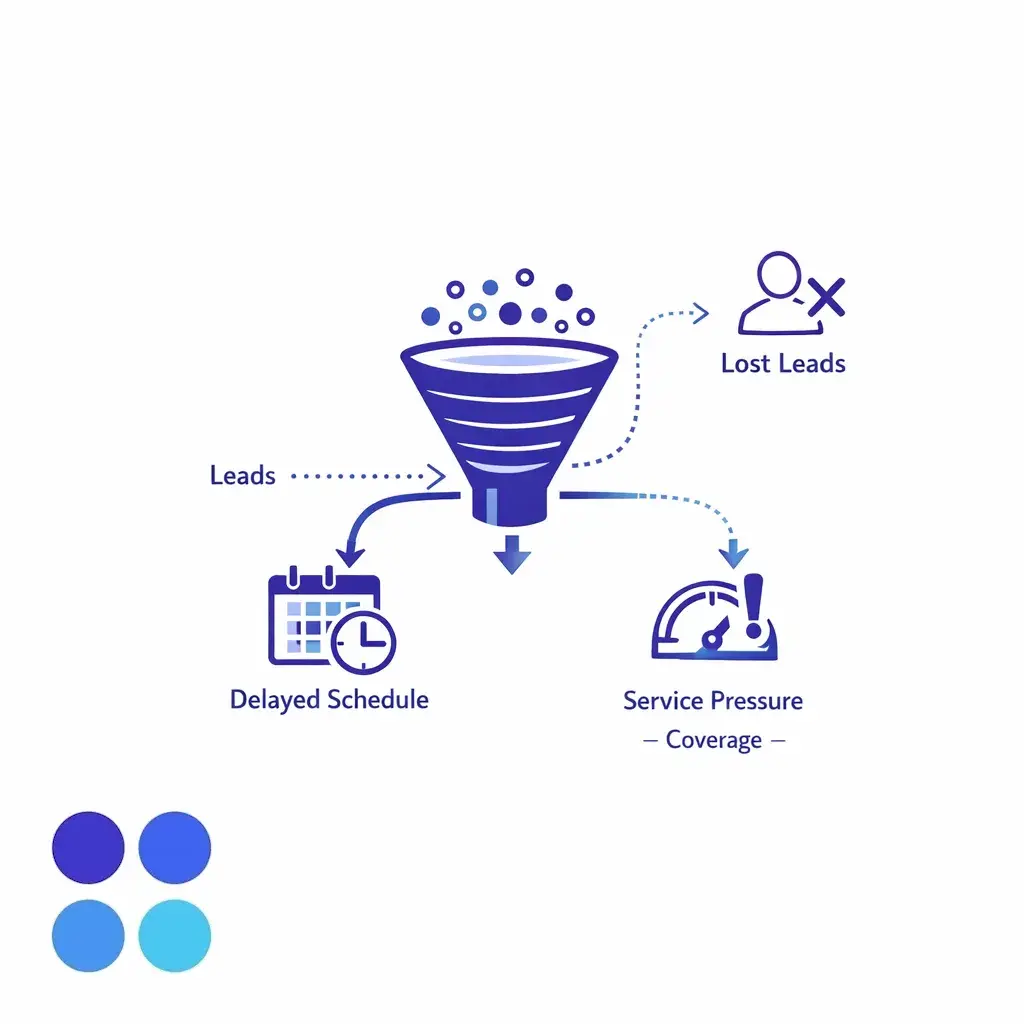
When callers hang up in the queue, the business feels it. Missed calls can mean missed appointments, lost leads, and delayed service, which makes abandonment one of the clearest signals that demand is outrunning the experience.
It also matters because the number is connected to other performance measures. When queue times climb, service levels slip, and routing gets messy, abandonment usually rises with them. That is why a good operator treats abandon rate as a symptom to diagnose, not just a KPI to report.
(Abandoned Calls ÷ Total Incoming Calls) × 100
Most teams use a version of the abandoned-calls divided by incoming-calls formula. The result tells you what percentage of callers gave up before they were answered.
The numerator is usually the number of inbound calls that abandoned before answer. The denominator is usually the total number of inbound calls offered to the queue or contact center.
This is where teams get tripped up. Platform metric definitions and reporting rules can differ on whether they count all offered calls, only queued calls, transfers, callbacks, or other edge cases. Before you compare teams, vendors, or time periods, confirm that everyone is using the same definition.
Many operations exclude immediate hangups that do not reflect a real wait experience, such as misdials or callers who disconnect within the first few seconds. The exact threshold is a business rule, not a universal law.
The important point is consistency. If your phone system exposes short-abandon definitions or configurable abandon thresholds, document the rule and keep it stable when you trend performance. Otherwise, one dashboard may show improvement while another only reflects a reporting change.
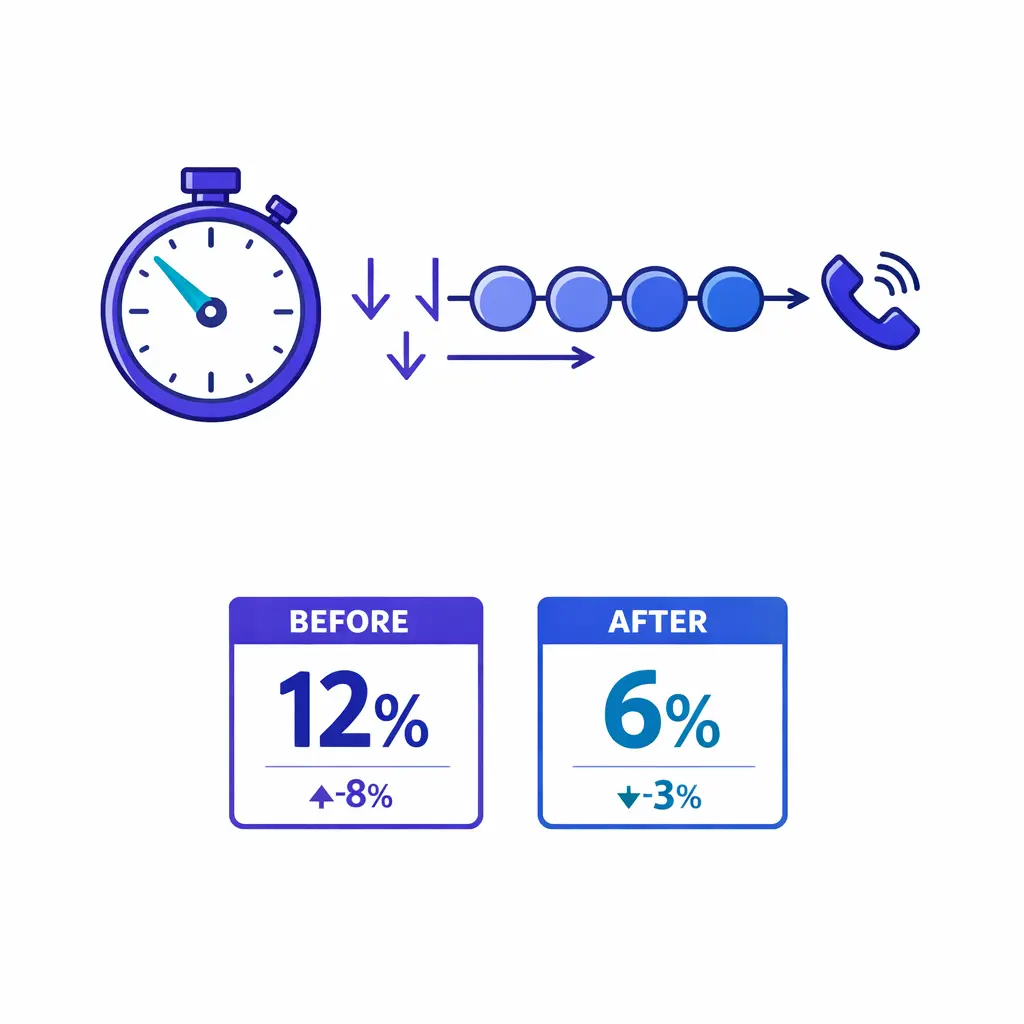
Immediate hangups, such as misdials, do not reflect a real wait. Many teams exclude these short abandons, which changes the math, so the key is choosing one definition and applying it consistently in reporting.
Say your intake line received 2,400 incoming calls last week. If 132 callers hung up before answer, your abandonment rate would be 5.5%.
(132 ÷ 2,400) × 100 = 5.5%
If you later decide to exclude 30 immediate hangups as short abandons, your adjusted figure becomes 4.25%. That is why it is worth settling the definition first. Otherwise, teams spend more time arguing about the number than fixing the experience behind it.
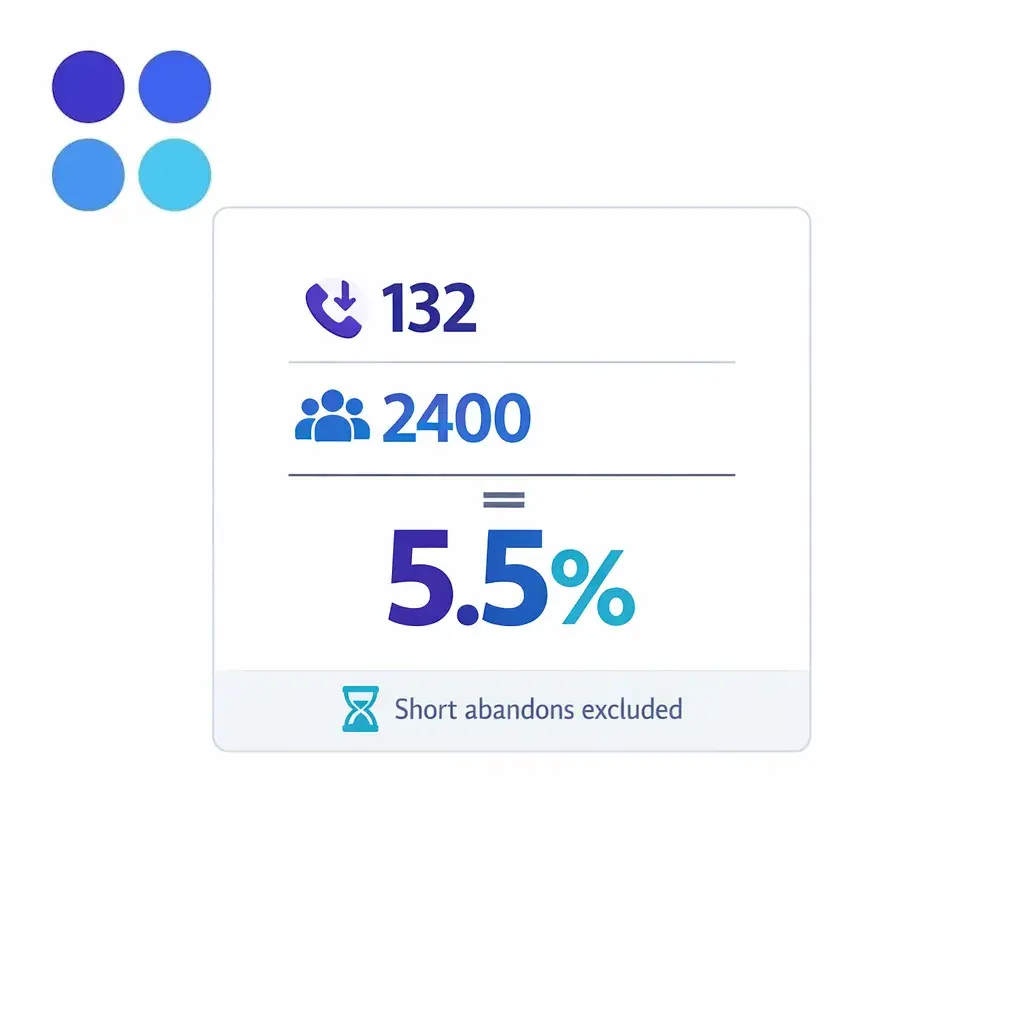
In the sample week, 132 of 2,400 incoming calls were abandoned, which works out to a 5.5% abandonment rate. Excluding immediate hangups as short abandons would lower that adjusted figure.
There is no single number that fits every queue, but a simple operating guide works well for most inbound service environments:
Treat those ranges as a management framework, not a law. The right target depends on urgency, caller intent, and what happens if the caller does not get through.
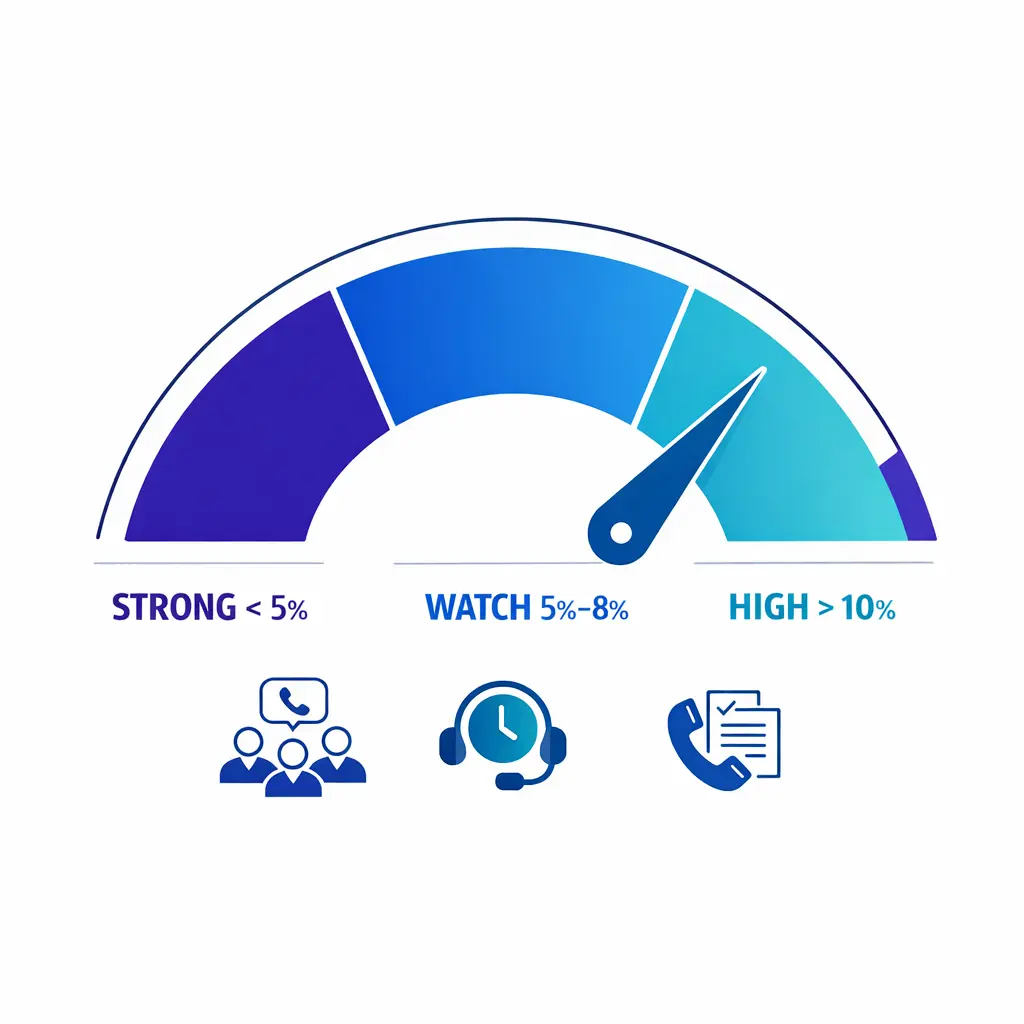
A simple guide helps most teams: under 5% is generally strong, 5% to 8% is a watch zone, and higher ranges signal a problem. Treat these as a management framework, not a fixed rule.
A scheduling queue, a bilingual intake line, an overflow answer service, and a mass tort intake queue should not all share one benchmark. Some callers will tolerate a short wait for a low-stakes question. Others are calling with urgent, high-value, or emotionally charged needs and will abandon quickly if the path feels slow or confusing.
That is why queue-level targets beat blended enterprise averages. If one queue is staffed for speed and another is designed for longer consultative calls, the same abandon-rate target can mislead both teams.
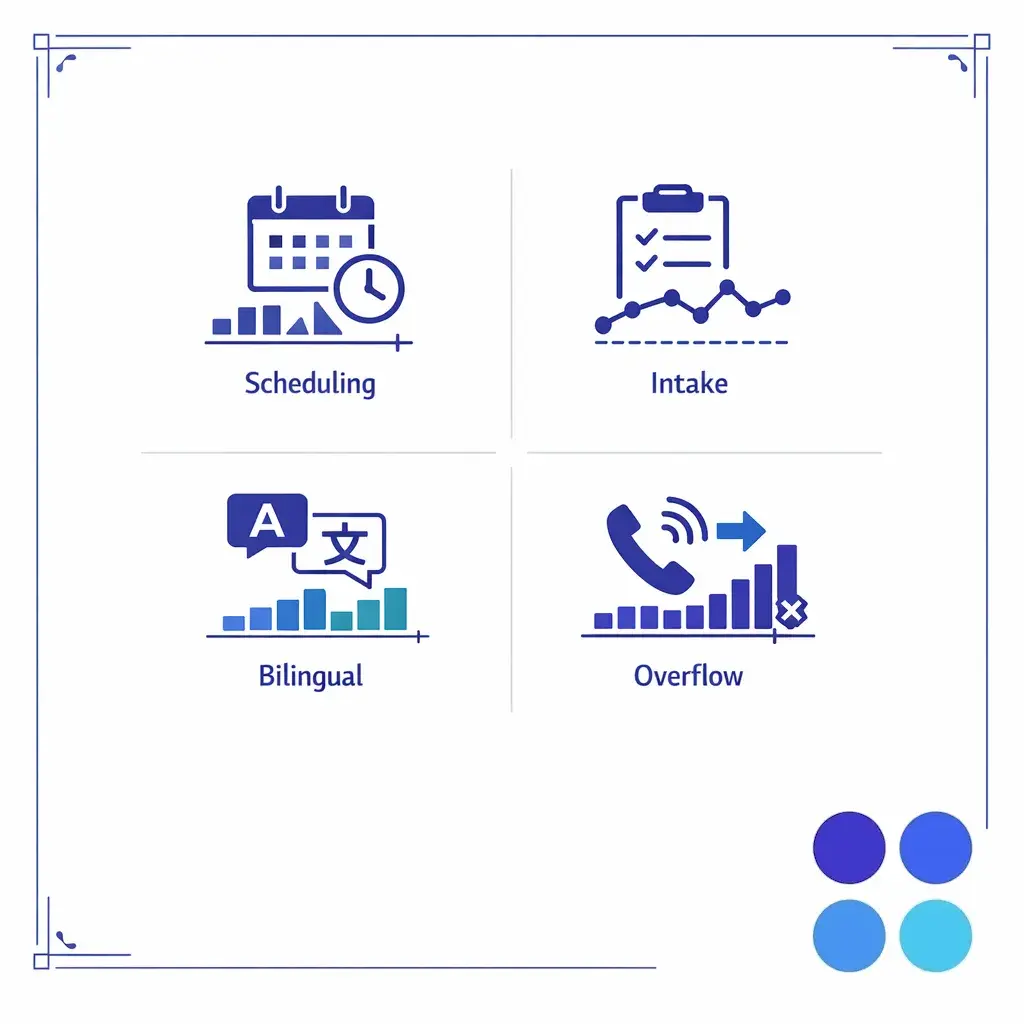
Scheduling, intake, bilingual, and overflow queues behave differently, so one benchmark cannot fit them all. Queue-level targets work better than a blended enterprise average that hides the queues needing attention.
Read abandonment alongside service level, average speed of answer, handle time, and occupancy metrics. If abandon rate rises while service level misses grow and answer speed slows, the problem is usually capacity, schedule adherence, or queue design. If abandon rate rises while answer speed stays stable, the issue may be routing, IVR friction, or calls entering the wrong queue.
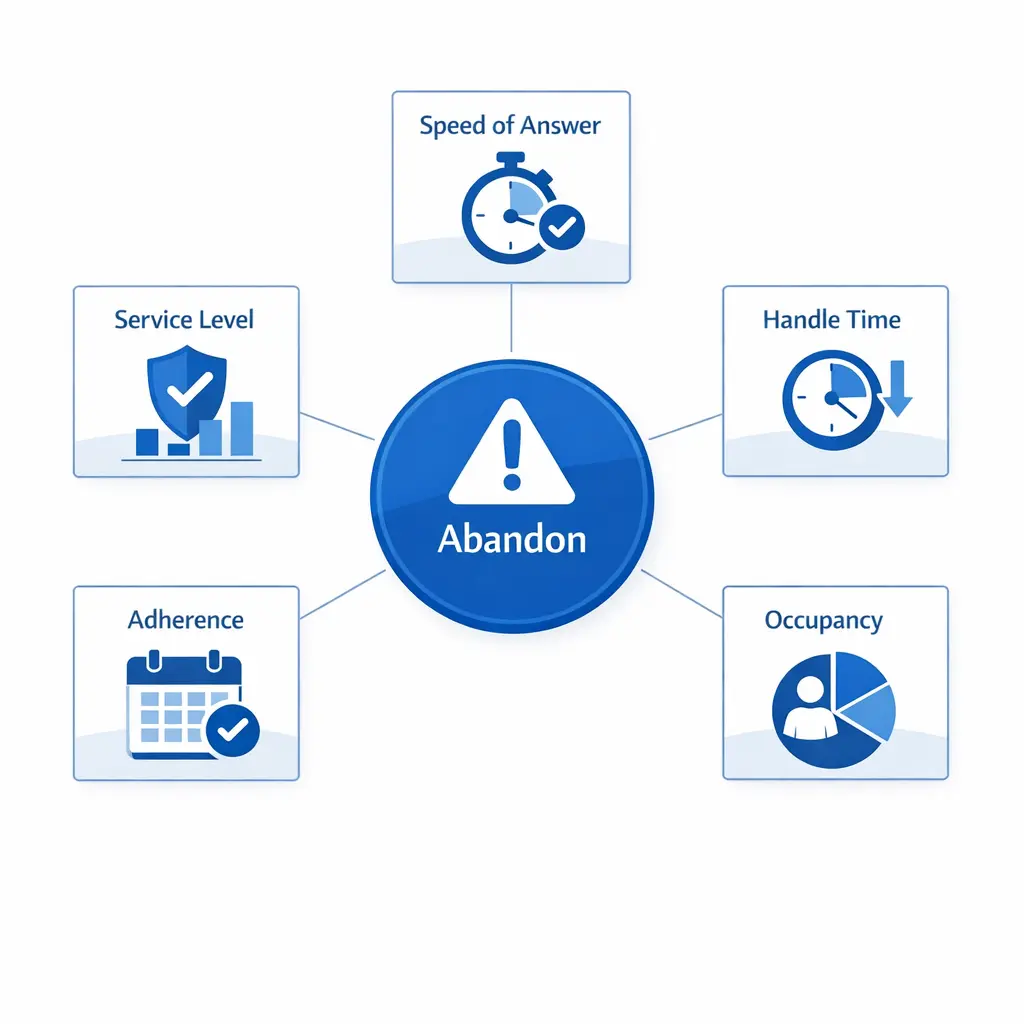
Abandonment should be read alongside service level, average speed of answer, handle time, occupancy, and adherence. Viewed together, these connected measures show whether the rate is a symptom of routing, staffing, or queue design.
If you also run outbound programs, do not confuse inbound service benchmarks with regulation for outbound dialing. The FTC Telemarketing Sales Rule safe harbor for abandoned calls addresses a different use case than inbound customer-service queues.
This is the first place to look. If callers are consistently waiting longer than they expect, many will leave before answer. Check your peaks by half hour, by day, and by queue, not just by daily average.
Also look for hidden delay. A queue can appear staffed on paper but still create long waits if high-handle-time calls pile up, agents go unavailable unexpectedly, or after-call work runs long.
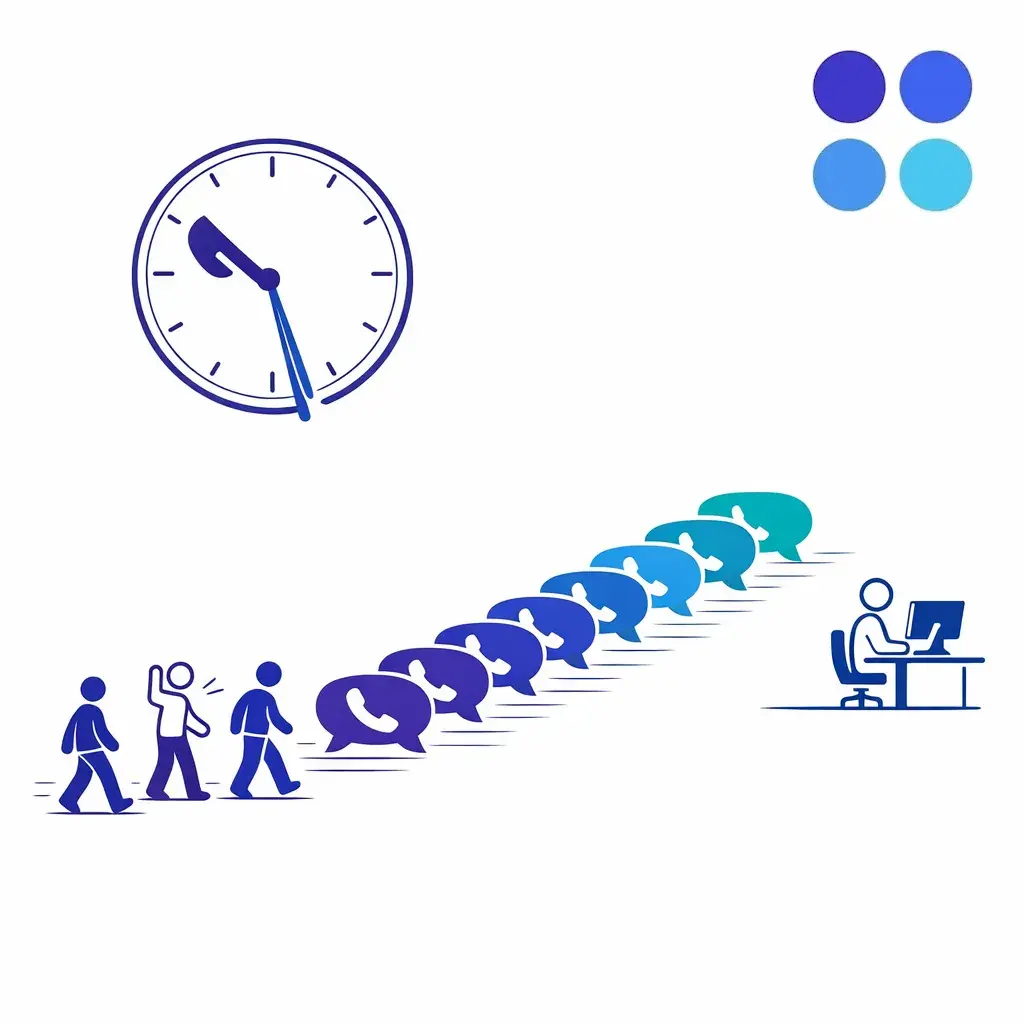
Long waits are the first place to look. When callers wait longer than they expect, many hang up before reaching an agent, and hidden delay can make a queue that looks staffed still create long waits.
Some callers abandon before they ever reach the real queue problem. Long greeting trees, too many options, loops between menus, or routing logic that sends callers to the wrong place can create frustration before the first ring to an agent.
If callers repeatedly press zero, ask to be transferred, or re-enter the system after hanging up, simplify the path. Good routing reduces wait time by getting the call to the right person sooner. Bad routing increases both queue time and repeat demand.
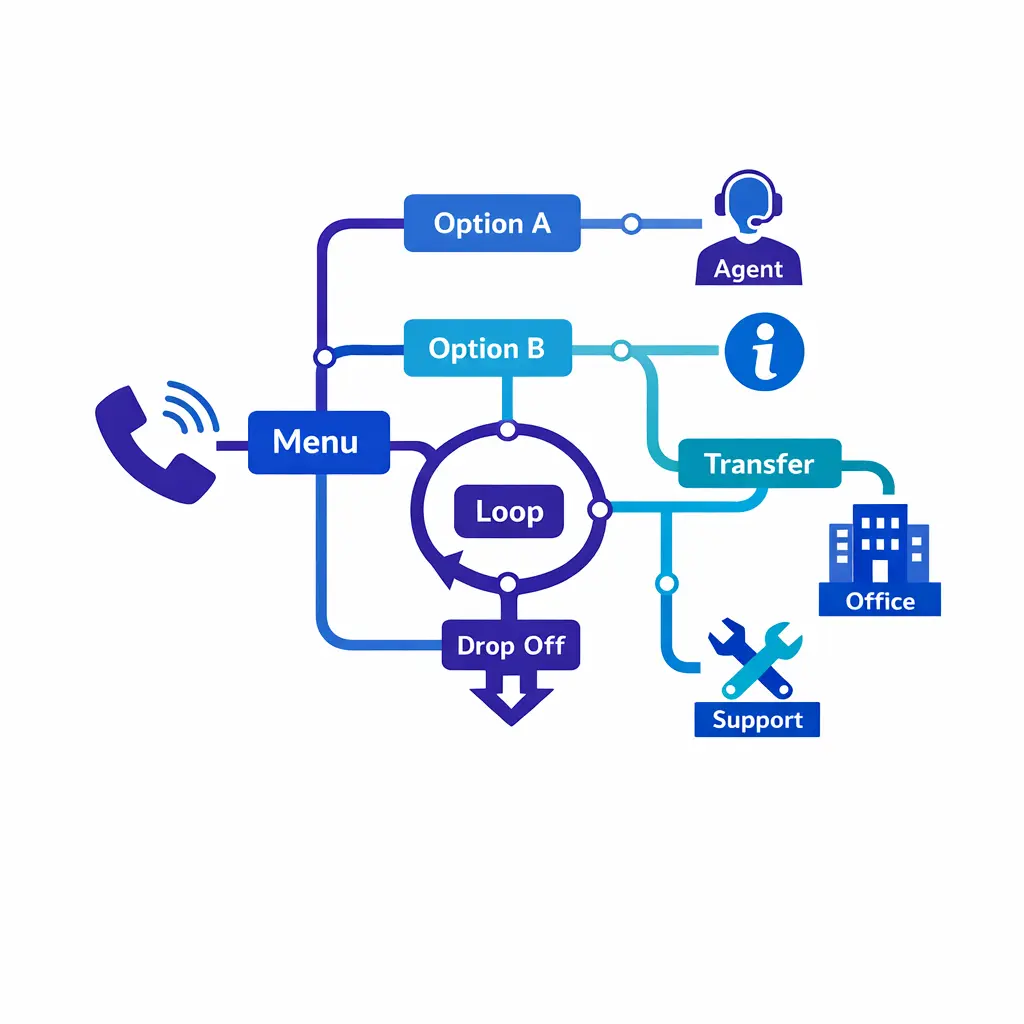
Long greeting trees and too many menu options can frustrate callers before they reach the real queue. Friction in the IVR and routing sends people away or back into the system, inflating abandonment.
High abandonment does not always mean you need more full-time staff. It often means coverage is mismatched to when demand actually arrives.
Look for concentrated spikes around openings, lunch, weather events, ad campaigns, billing cycles, court deadlines, or referral bursts. If the problem is a narrow peak, the answer is usually better forecasting, schedule changes, overflow support, or after-hours coverage, not all-day overstaffing.
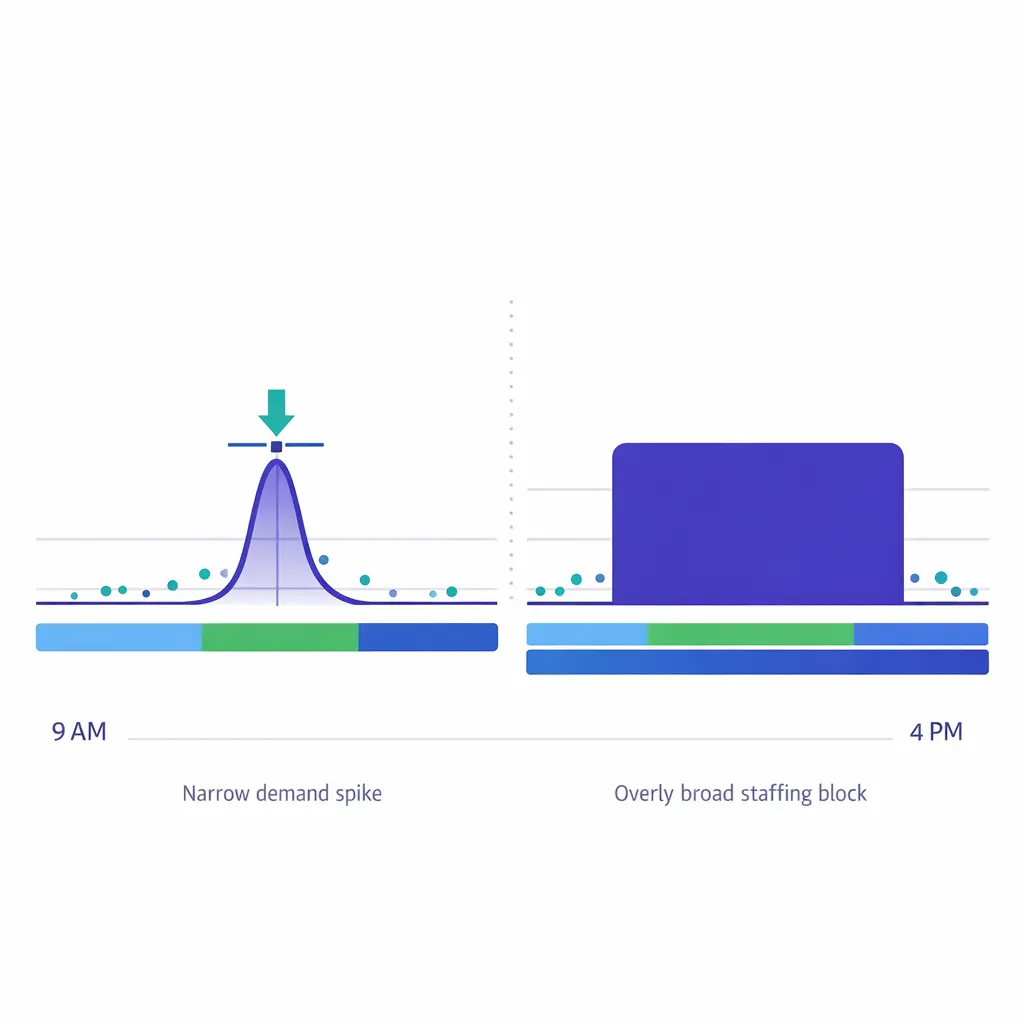
Abandonment often means coverage is mismatched to demand rather than that you need more full-time staff. Narrow spikes around openings, lunch, or campaigns can overwhelm a flat, all-day staffing plan.
When self-service paths fail, those callers reappear in the queue. When first-call resolution is weak, the same thing happens. The result is more inbound volume than your staffing model expected, which pushes wait times up and abandon rate with them.
If your queue volume rises without a matching rise in new business activity, check for repeat-contact patterns, broken web forms, portal confusion, unresolved follow-ups, or intake steps that force callers to start over.
When the problem is a temporary spike, callbacks can preserve the lead or service request without forcing the caller to sit in hold. This is especially useful for legal intake, medical scheduling, and overflow scenarios where the caller wants certainty more than immediate connection.
Use callbacks selectively. They work best when you can return the call inside a reliable window and when your reporting clearly separates queued callbacks from standard live-answer traffic.
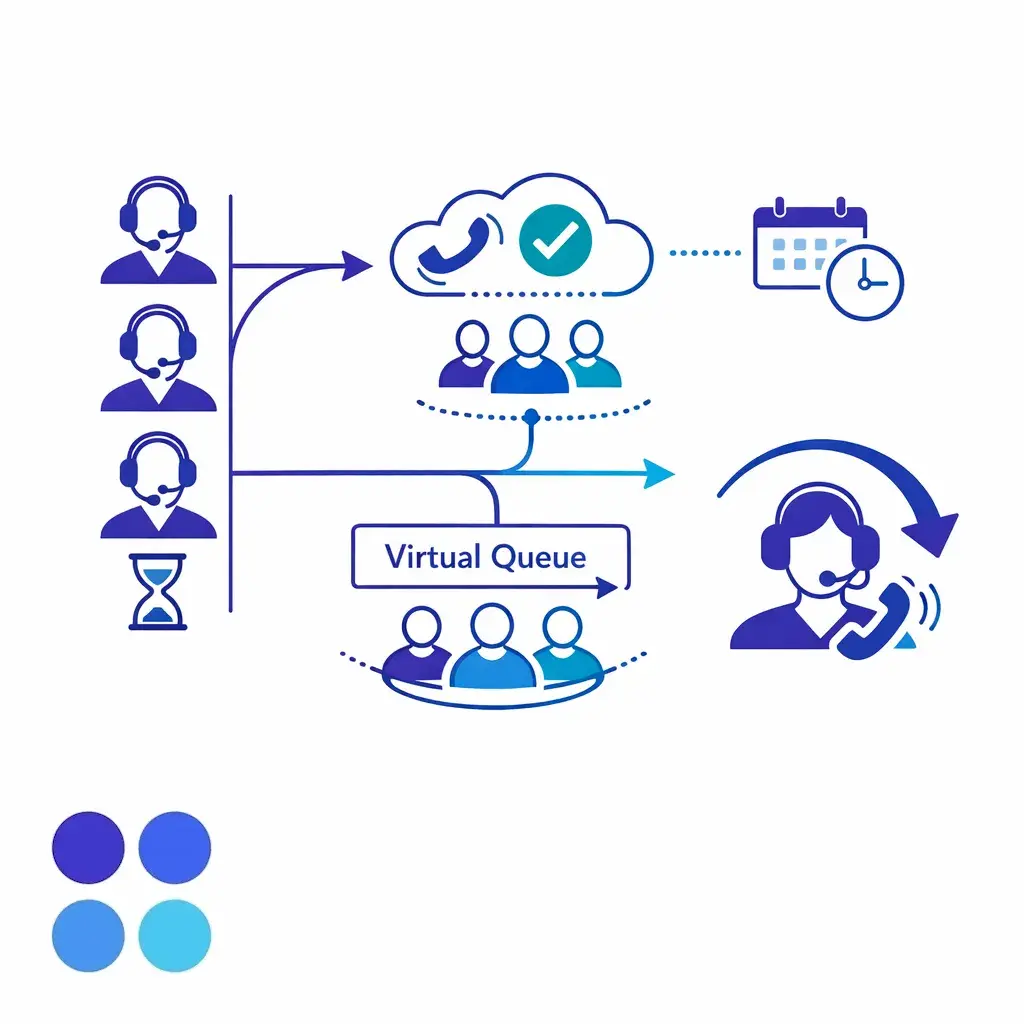
A callback or virtual queue lets callers keep their place and receive a return call later. Used selectively, it preserves the lead or service request without forcing people to wait on hold.
Do not solve a one-hour problem with an eight-hour staffing increase. Forecast by interval, not by daily total, then adjust lunch placement, breaks, skills assignments, and overflow rules around real demand curves.
Intraday management matters just as much as forecasting. If traffic shifts at noon but schedules lock at nine, abandon rate will stay high even with enough total labor on the plan.

Forecasting by interval instead of by daily total reveals the peaks a single number hides. Matching schedules to those shorter intervals solves a one-hour problem without an all-day staffing increase.
Make it easier to reach the right team on the first attempt. Reduce option count, shorten greetings, remove dead-end branches, and map common intents to the fewest possible steps.
Then audit transfers. If a large share of answered calls still bounce between teams, the caller experience is slower than your raw answer metric suggests.
Every unresolved call creates future volume. Train agents on the issues that cause the most repeat contacts, tighten intake scripts, and make sure agents can collect enough information to complete the next step without a second call.
In legal and healthcare environments, better intake quality also prevents rework later. That lowers handle time pressure on future shifts and gives the queue more breathing room.
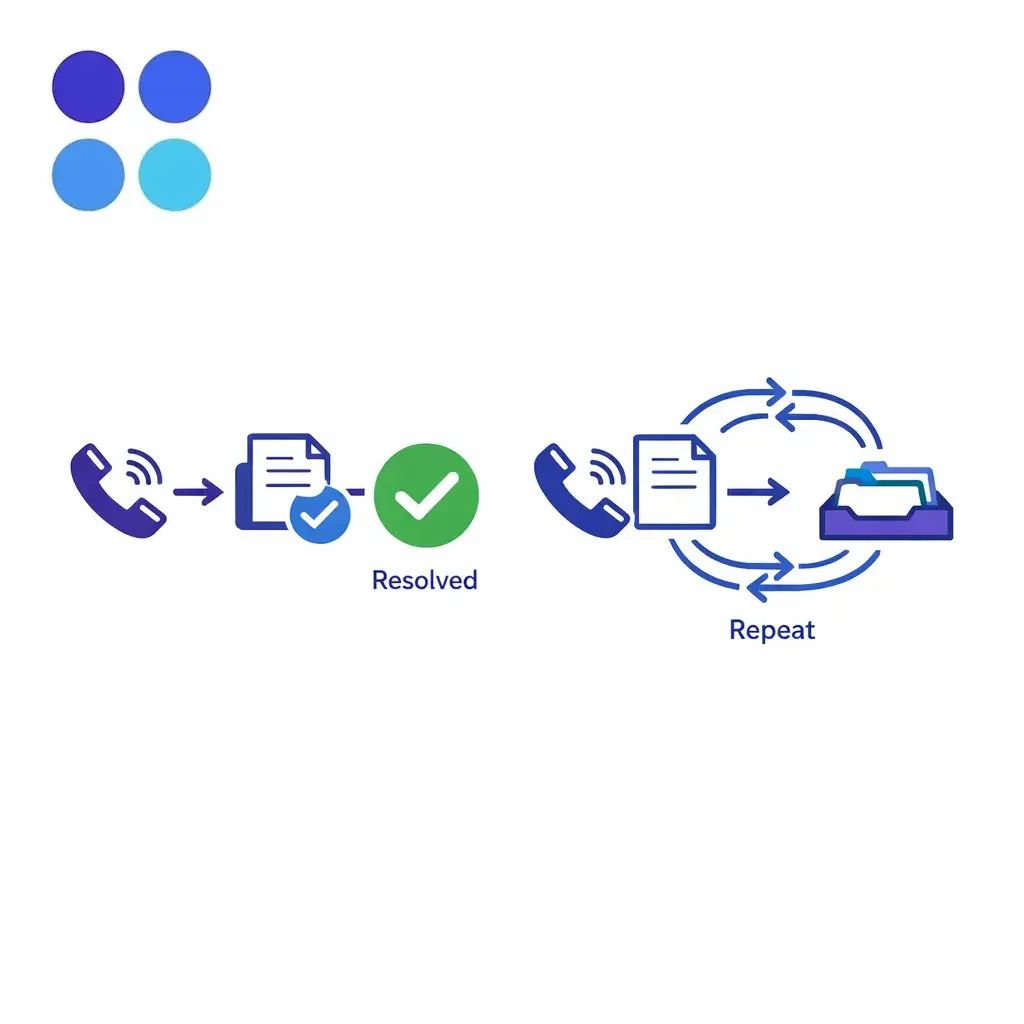
Every unresolved call creates future volume for the queue. When first-call resolution improves, the loop closes and fewer repeat contacts return to the queue, which lowers tomorrow's call volume and helps bring abandonment down over time.
Use self-service for tasks that are simple, repeatable, and low risk. Balance inquiries, basic status checks, appointment confirmations, office hours, payment prompts, and common policy questions are usually better candidates than complex or emotionally sensitive issues.
The goal is not to hide the phone number. It is to reserve trained human time for the calls where judgment, empathy, or compliance-aware intake really matter.
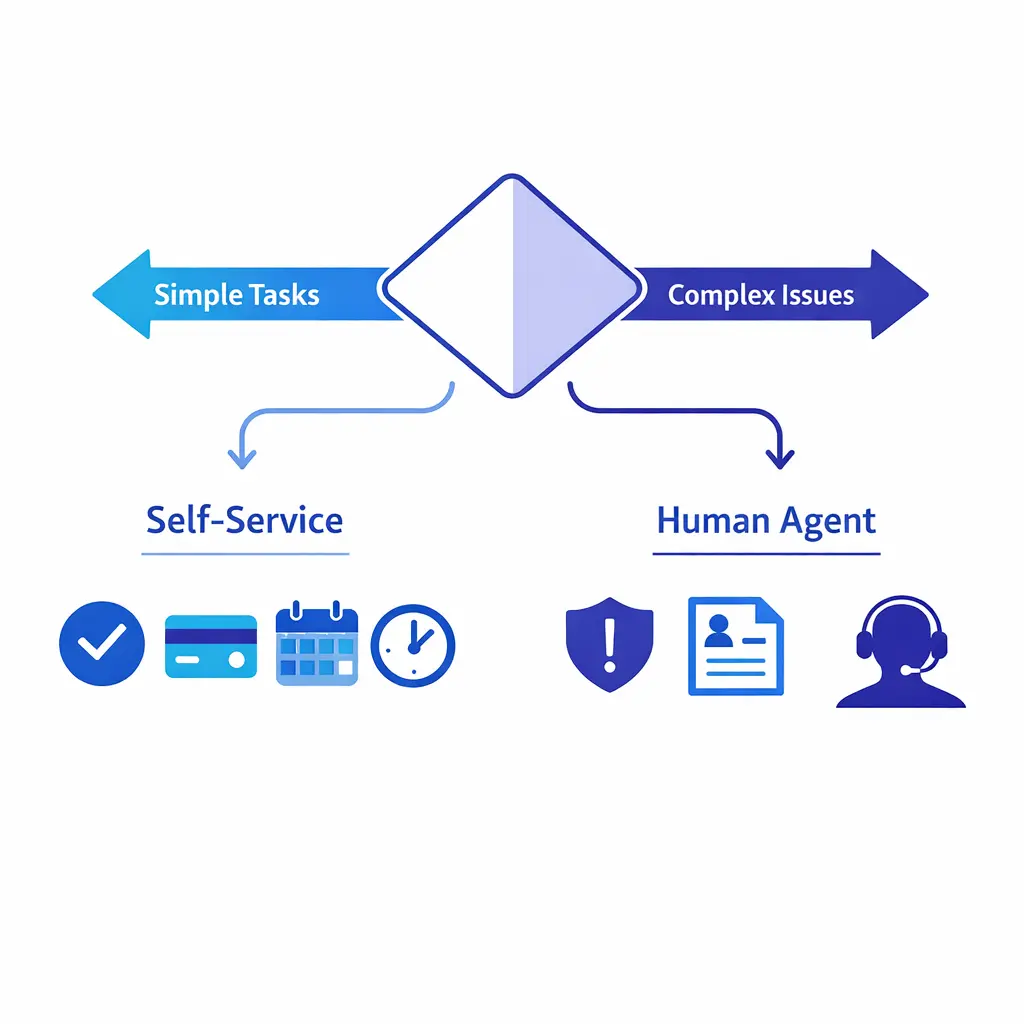
Simple, repeatable, low-risk tasks such as status checks and confirmations can go to self-service. That reserves trained human time for the calls where judgment, empathy, or accuracy matters most, while routine requests are handled quickly and accurately on their own.
By the time a weekly report shows a bad abandon rate, the damage is already done. Set threshold alerts for queue depth, answer speed, occupancy, and abandon spikes so supervisors can change coverage, trigger overflow, or offer callbacks before the hour is lost.
If your operation spans multiple locations or vendors, keep one shared view of the queue. Local teams can optimize their own staffing, but someone still needs a system-wide picture of where demand can be absorbed safely.
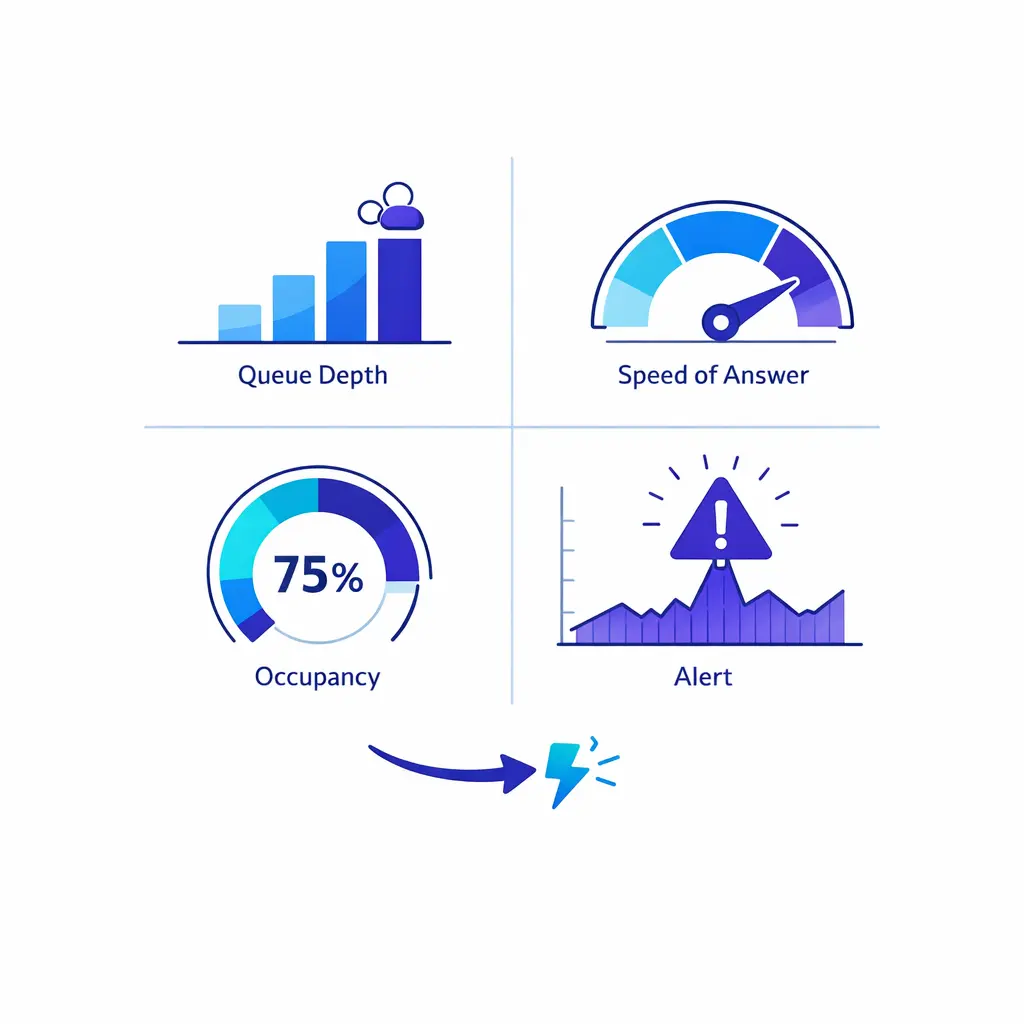
A live dashboard with threshold alerts helps supervisors react to queue depth before abandonment spikes worsen. Acting in real time beats discovering the damage later in a weekly report, when callers are already gone.
Track abandonment with the surrounding metrics, not in isolation. The most useful operating set usually includes these:
If abandonment is high but occupancy is low, the issue may be routing or availability states rather than staffing. If occupancy is high, answer speed is slipping, and adherence is loose, fix the operating discipline before you assume the labor model is wrong.
If you count every immediate hangup the same way, your queue may look worse than the live experience really is. If you exclude too many, the queue may look healthier than it is. Set a rule, document it, and apply it consistently.
A single enterprise average can hide the queues that truly need intervention. Break the metric out by location, line of business, language, time of day, and call intent before you decide what to fix.
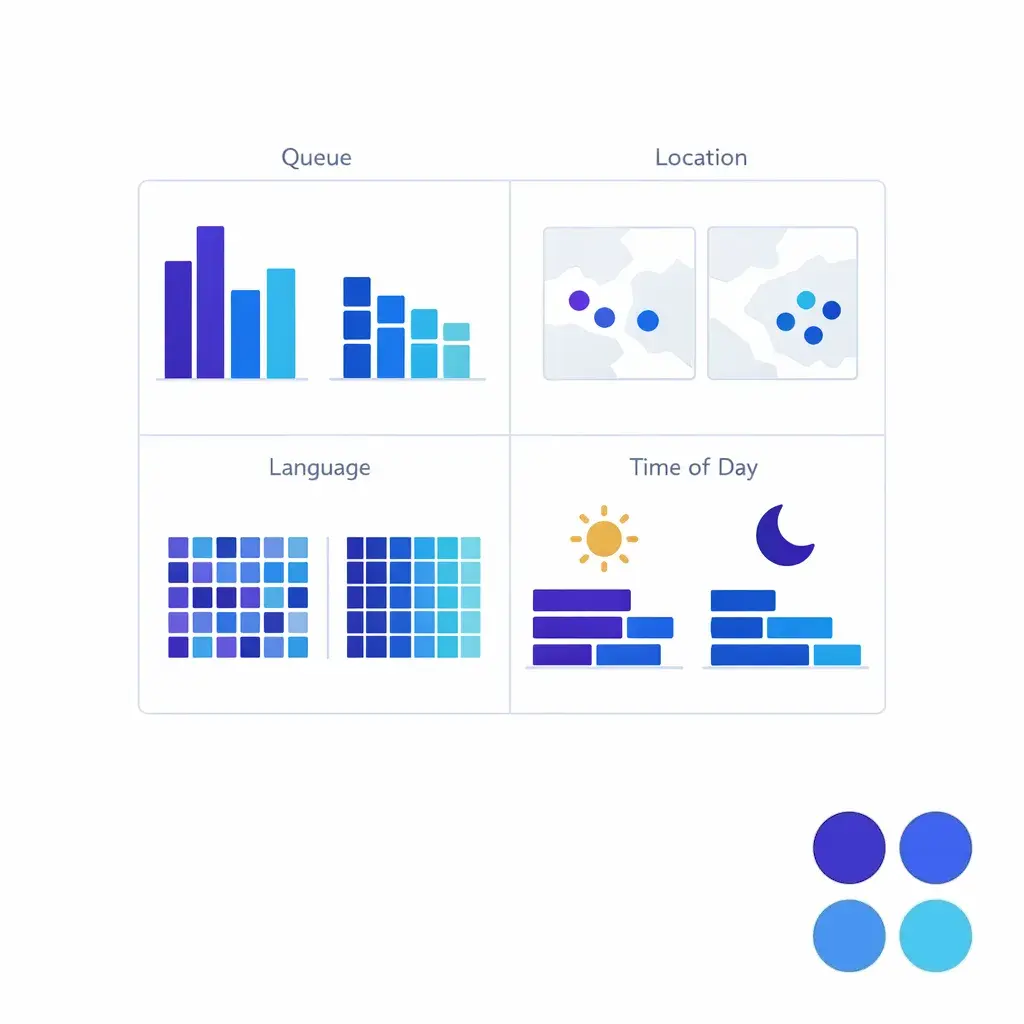
A single blended average can hide the queues that need help. Breaking abandonment out by queue, location, and time block shows where the problem actually sits and where to intervene.
Abandonment tells you what happened. It does not tell you why. If your dashboards stop at abandon rate alone, your team will end up debating staffing levels when the real problem may be routing, repeat contacts, or schedule adherence.
Some callers will call back. Some will move to chat, text, web intake, or self-service. Others are gone for good. The point is to measure what happens next, because the right fix depends on whether your abandoned callers are recoverable or simply disappearing.
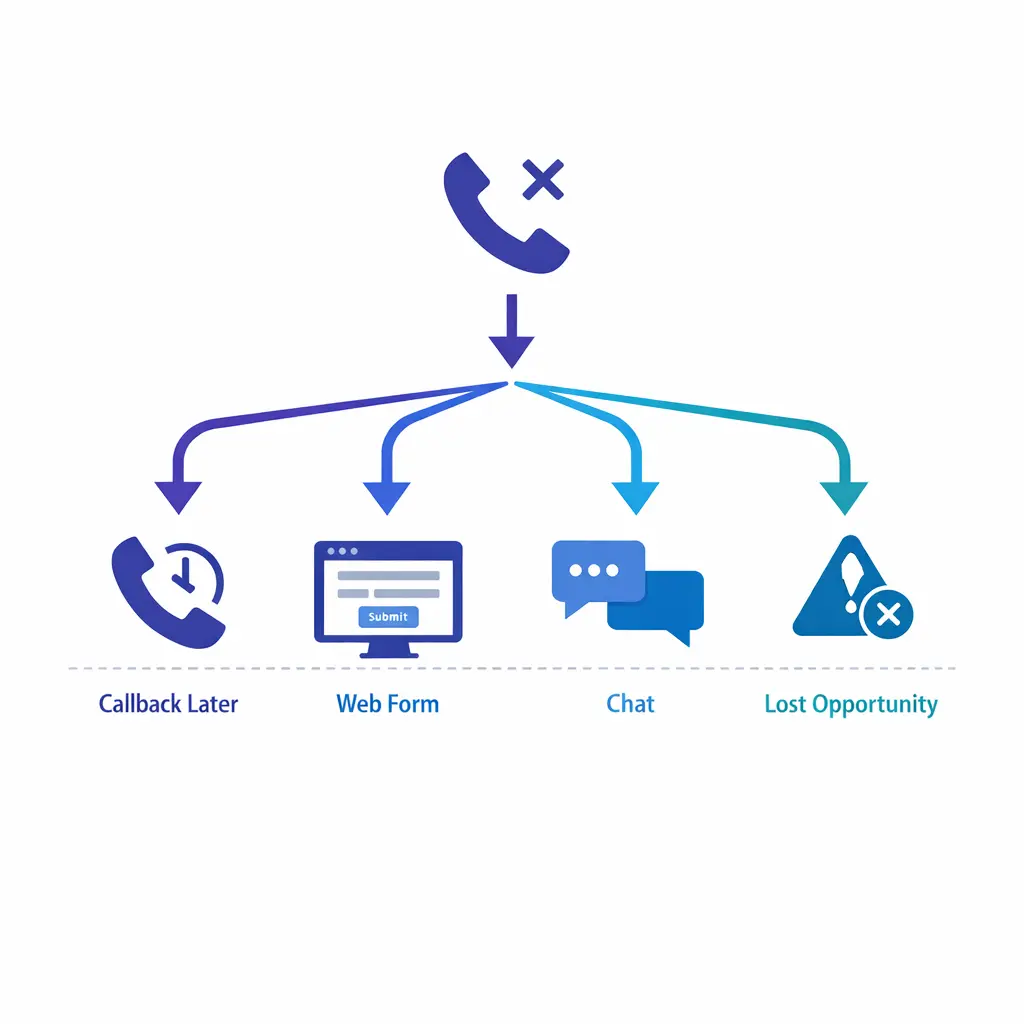
Not every abandoned caller is lost. Some call back, while others move to chat, text, web intake, or self-service, so outcomes should be tracked rather than assuming every abandon is a permanent loss.
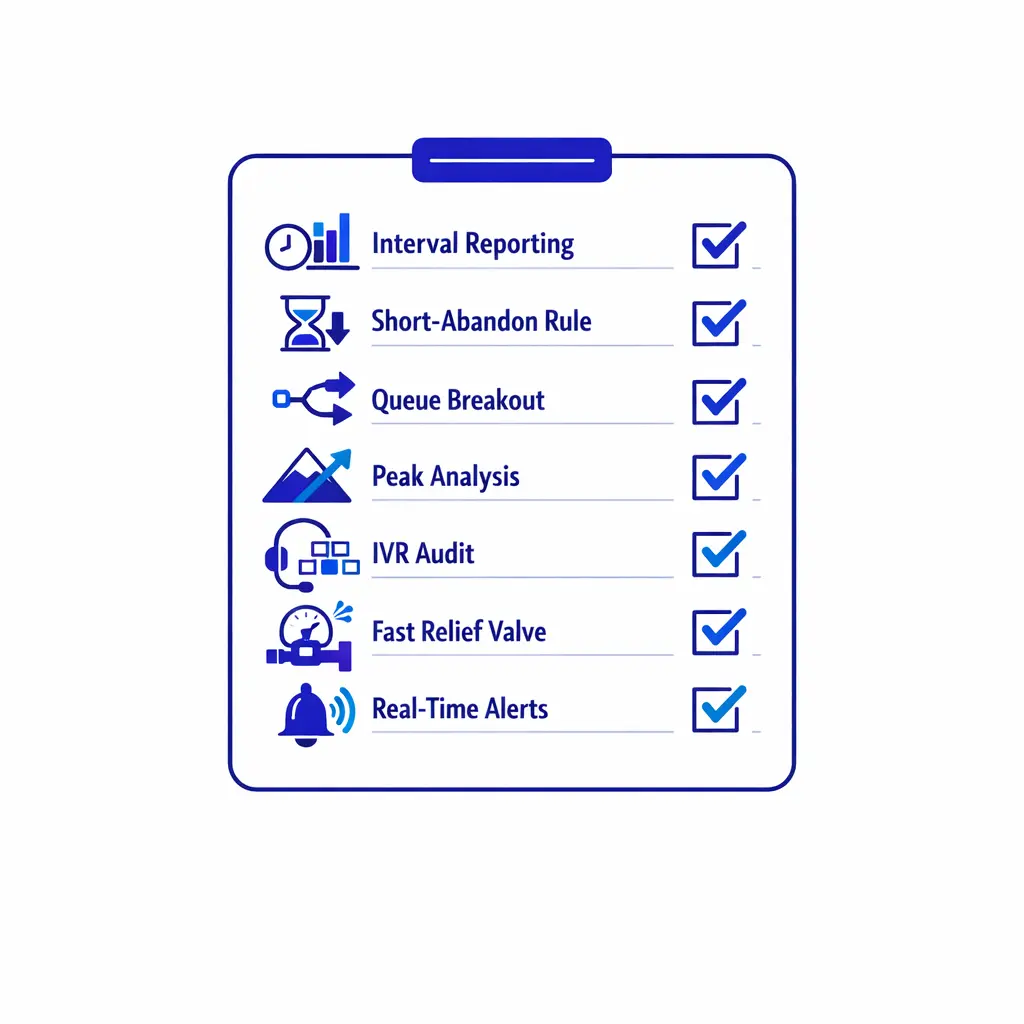
A practical next step is a short checklist of actions covering forecasting, routing, callbacks, and alerts. Start by pulling recent data by interval, then work through the fixes in order.
A practical target for many inbound teams is under 5%, with 5% to 8% as a warning zone and anything above 10% as a signal for immediate review. The right target still depends on queue type, urgency, and the cost of a missed call.
Use this formula: (Abandoned Calls ÷ Total Incoming Calls) × 100. Just make sure your team agrees on whether short abandons, callbacks, and non-queued calls are included.
Start with the least expensive fix that addresses the real cause. That usually means improving interval forecasting, tightening schedules, simplifying routing, offering callbacks during peaks, and reducing repeat contacts through better first-call resolution.
A short abandoned call is a caller who disconnects almost immediately, often before the queue experience meaningfully starts. The exact threshold depends on your platform and reporting setup, so align on one rule before you trend the number.
If your team is missing calls during peaks, after hours, or across multiple locations, Go Answer can help you improve coverage without forcing a permanent staffing increase. That is especially useful when you need reliable intake quality, overflow support, and clear operational visibility rather than a simple message-taking service.
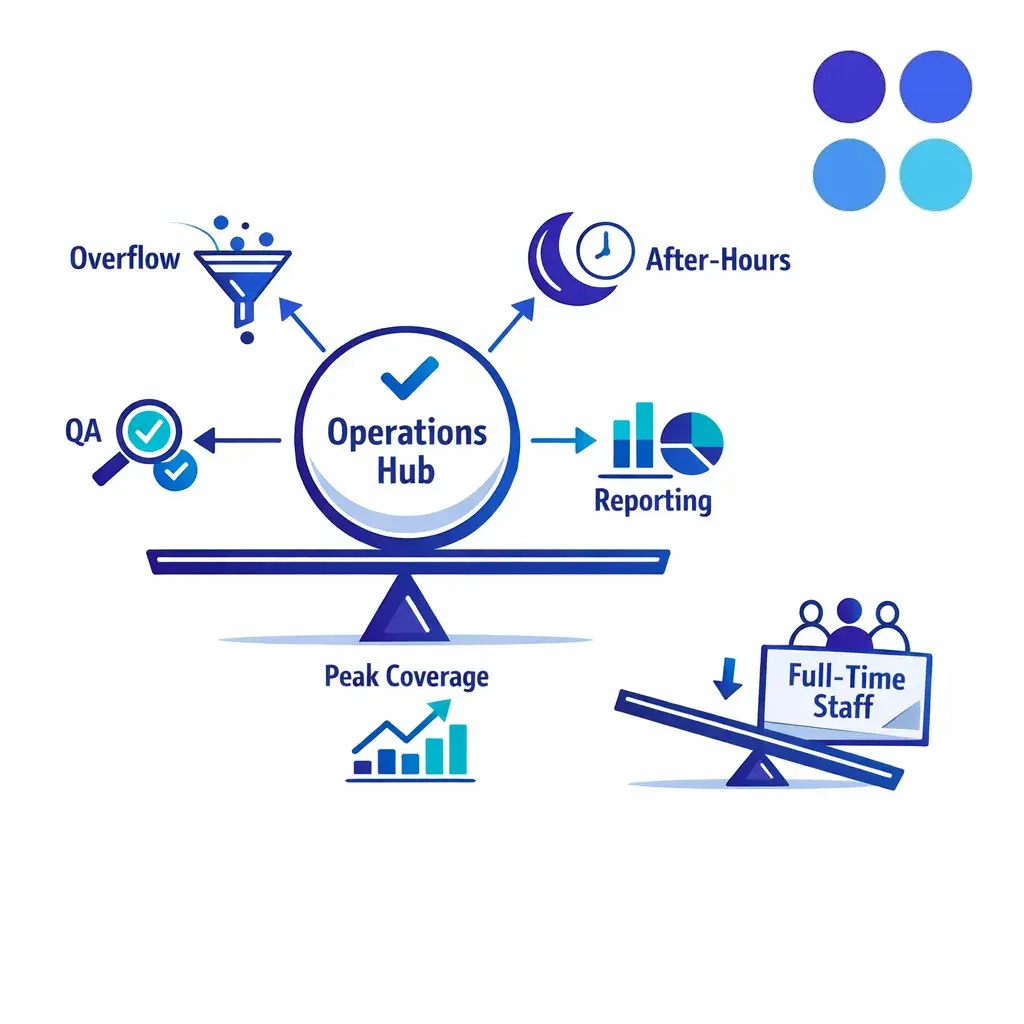
Flexible coverage can balance overflow, after-hours, and peak support without a permanent headcount increase. That lets teams protect answer rates during busy periods while keeping costs in check and avoiding unnecessary full-time hires.
You can Book a Discovery Call to review your current queue design, coverage gaps, and intake workflow, or Request Pricing if you already know the hours, call types, or business units that need support.

Learn why thousands of companies rely on Go Answer.
Try us risk-free for 14 days!
Enjoy our risk-free trial for 14 days or 200 minutes, whichever comes first.
Have more questions? Call us at 888-462-6793
Learn why thousands of companies rely on Go Answer.
Have more questions? Call us at 888-462-6793
If you would like to get in contact with a Go Answer representative please give us a call, chat or email.

Thanks for your interest!
A representative will be reaching out to you shortly.
Have more questions? call us on 888-462-6793
